Explore a wide variety of free Excel templates designed specifically for performance analysis. These templates typically include sections for tracking key performance indicators (KPIs), visualizing data through charts, and analyzing trends over time. You can easily customize these spreadsheets to suit your specific needs, making it easier to assess performance metrics and drive informed decision-making.
Financial performance analysis Excel template
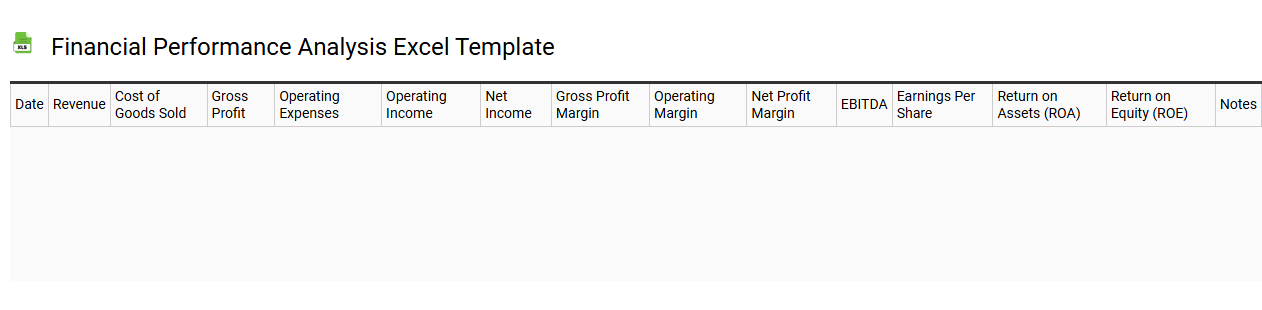
💾 Financial performance analysis Excel template template .xls
A Financial Performance Analysis Excel template is a structured tool that helps individuals or businesses evaluate their financial health. This template typically includes key financial indicators such as revenue, expenses, profit margins, and return on investment ratios. Users can input real-time data to generate visualizations like charts and graphs, making it easier to interpret results. Basic usage includes tracking month-to-month performance, while further potential needs may involve advanced forecasting models and variance analysis for deeper insights.
Employee performance analysis Excel template
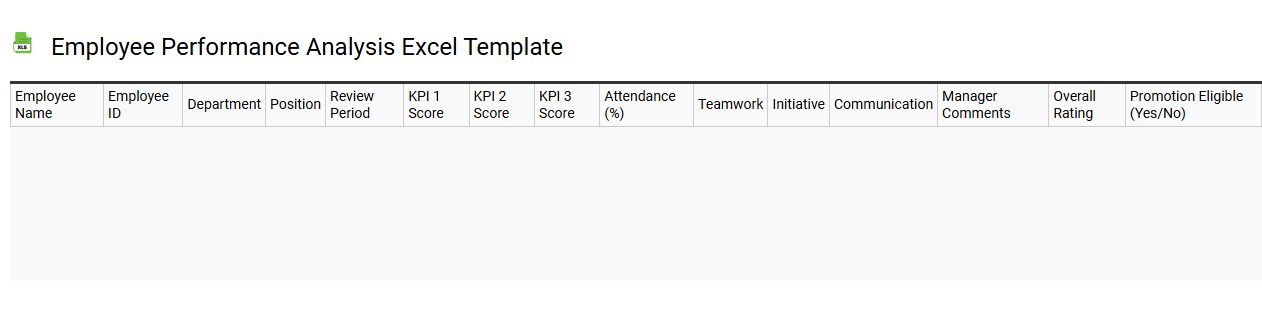
💾 Employee performance analysis Excel template template .xls
An Employee Performance Analysis Excel template is a structured spreadsheet designed to assess and track employee productivity and effectiveness. This template typically includes essential metrics such as key performance indicators (KPIs), departmental objectives, individual goals, and performance ratings. Visual tools like charts and graphs can reveal trends over time, helping you identify strengths and areas for improvement. With its straightforward layout, this tool can serve basic evaluation needs while allowing for advanced customization, such as integrating predictive analytics and machine learning features to enhance decision-making.
Project performance analysis Excel template
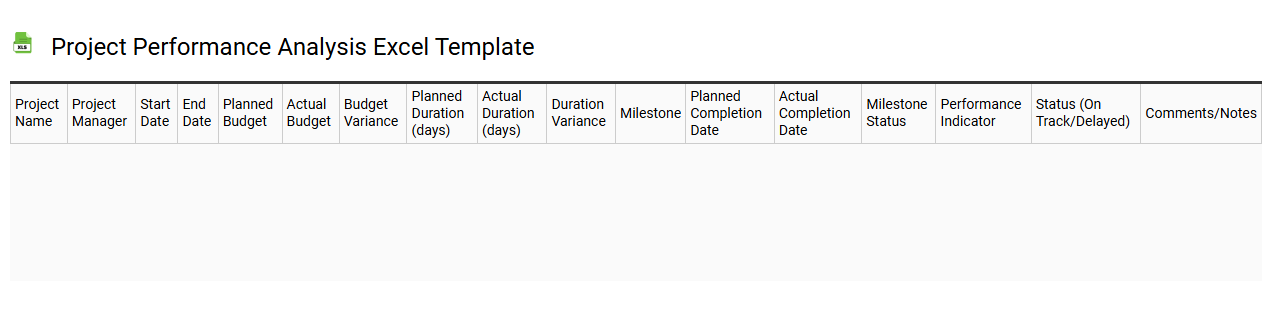
💾 Project performance analysis Excel template template .xls
A Project Performance Analysis Excel template is a structured tool designed to help you assess and track the progress of various project metrics, such as time, cost, scope, and quality. This template typically includes predefined categories for key performance indicators (KPIs), facilitating clear visual insights through charts and graphs. Users can input real-time data to compare planned versus actual performance, enhancing decision-making capabilities and resource allocation. Beyond basic analysis, you may want to leverage advanced features like pivot tables, macros, or automated dashboards to enhance your project's strategic oversight and forecasting potential.
KPI performance analysis Excel template
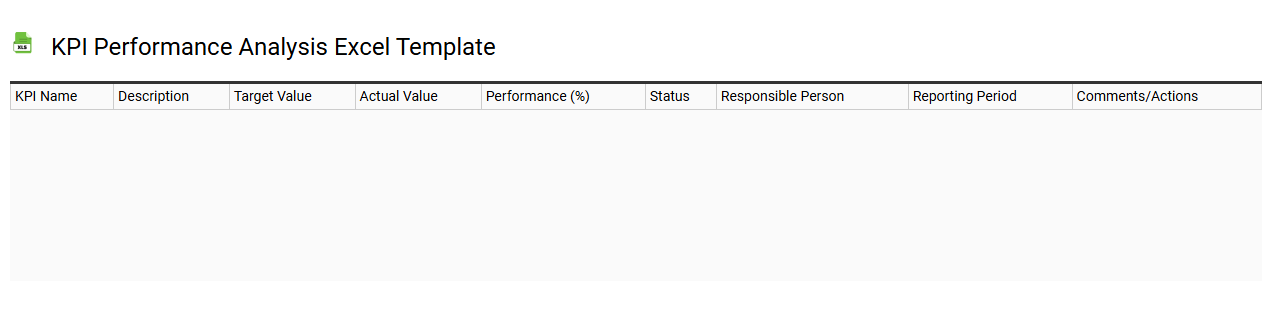
💾 KPI performance analysis Excel template template .xls
A KPI performance analysis Excel template is a structured spreadsheet designed to help you track and evaluate key performance indicators (KPIs) relevant to your business or project. This template typically features predefined sections for inputting data, visual summaries like charts or graphs, and formulas to calculate performance metrics over time. You can customize it to suit specific goals, allowing you to monitor progress and identify trends efficiently. Consider using this foundational tool not only for basic KPI tracking but also for more complex analyses involving predictive modeling and data visualization techniques.
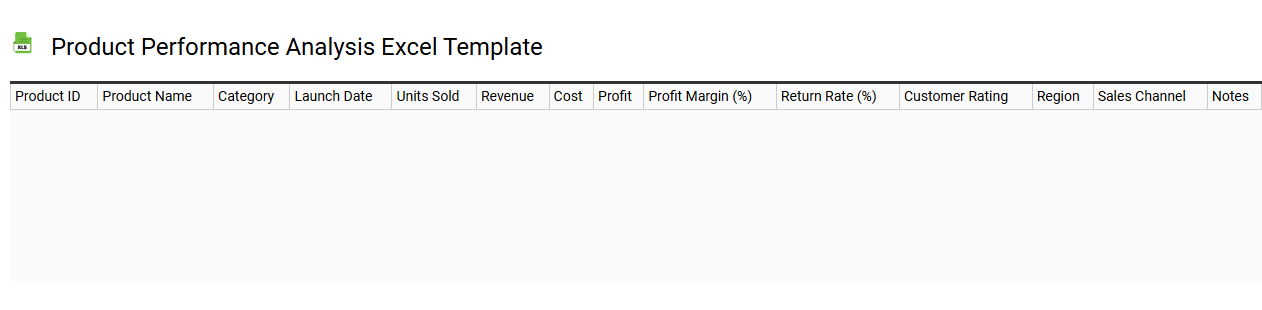
Product performance analysis Excel template
💾 Product performance analysis Excel template template .xls
A Product Performance Analysis Excel template enables efficient tracking and evaluation of product metrics over time. This customizable tool incorporates key performance indicators (KPIs), such as sales figures, customer feedback, and market trends, allowing for comprehensive insights into product viability and consumer interest. Detailed visualizations can be generated within the template, offering you a clearer understanding of performance fluctuations and potential areas for improvement. Besides basic analytics, the template can be adapted for advanced statistical techniques like regression analysis or predictive modeling to further enhance product strategy implications.
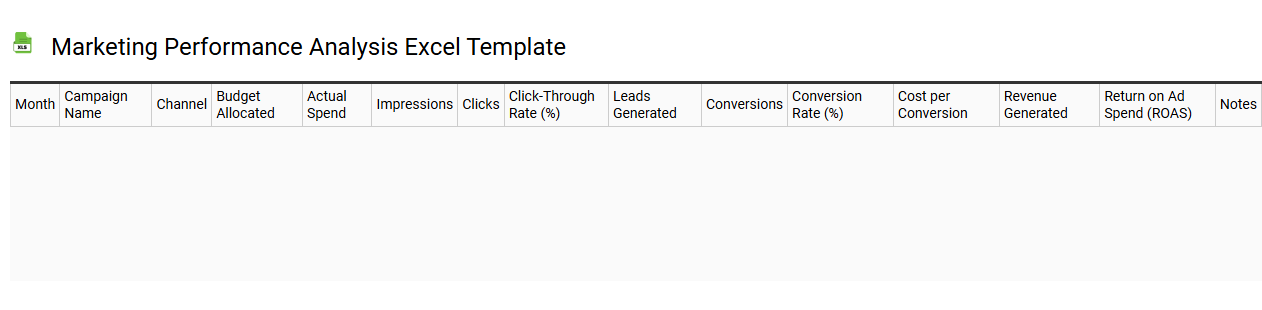
Marketing performance analysis Excel template
💾 Marketing performance analysis Excel template template .xls
A Marketing performance analysis Excel template is a structured tool designed to help you evaluate the effectiveness of your marketing strategies quantitatively. This template typically includes sections for tracking key performance indicators (KPIs), such as conversion rates, return on investment (ROI), and customer acquisition costs, allowing for a detailed assessment of marketing efforts. It may feature built-in graphs and charts for visual representation, aiding in easy analysis and decision-making. Basic usage includes inputting data to track campaign performance, while advanced applications can incorporate predictive analytics and data modeling for more sophisticated insights.
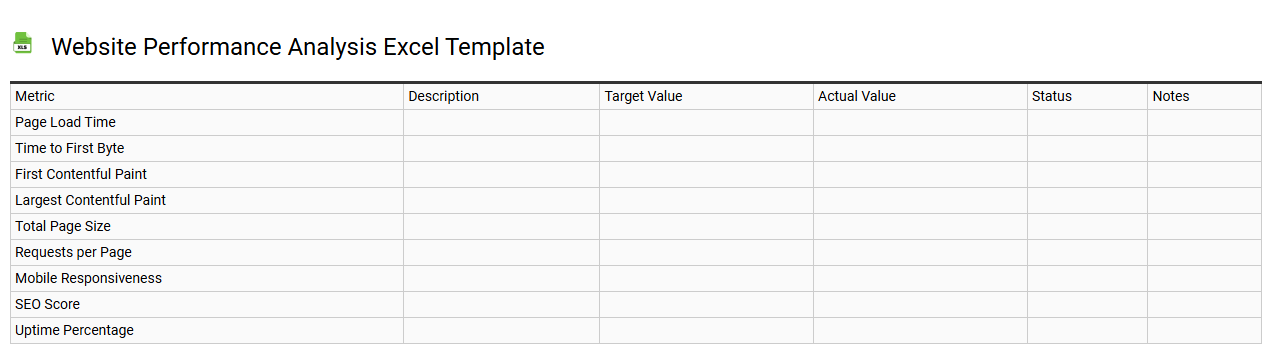
Website performance analysis Excel template
💾 Website performance analysis Excel template template .xls
A Website performance analysis Excel template is a structured tool designed to evaluate key metrics that impact your website's effectiveness. It typically includes sections for tracking page load times, bounce rates, unique visitors, conversion rates, and user engagement levels. By utilizing this template, you can easily organize data to visualize trends and identify areas that need improvement. Basic usage of this template can help you analyze performance, while further potential needs may involve integrating advanced analytics tools like Google Analytics or implementing A/B testing methodologies for deeper insights.
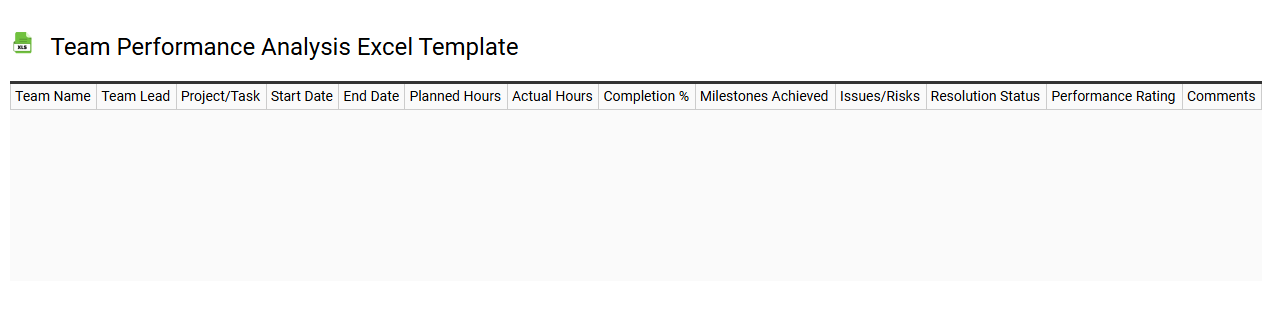
Team performance analysis Excel template
💾 Team performance analysis Excel template template .xls
A Team Performance Analysis Excel template is a structured spreadsheet designed to track and evaluate the effectiveness of a team's performance over time. This tool often includes various metrics such as productivity rates, project completion timelines, and individual contributions, allowing for a comprehensive view of team dynamics. You can customize these templates to fit specific team goals, incorporating visual elements like graphs and charts to enhance data comprehension. Beyond basic evaluations, such templates can support advanced analyses like predictive modeling and performance forecasting, catering to evolving management strategies.
Monthly performance analysis Excel template
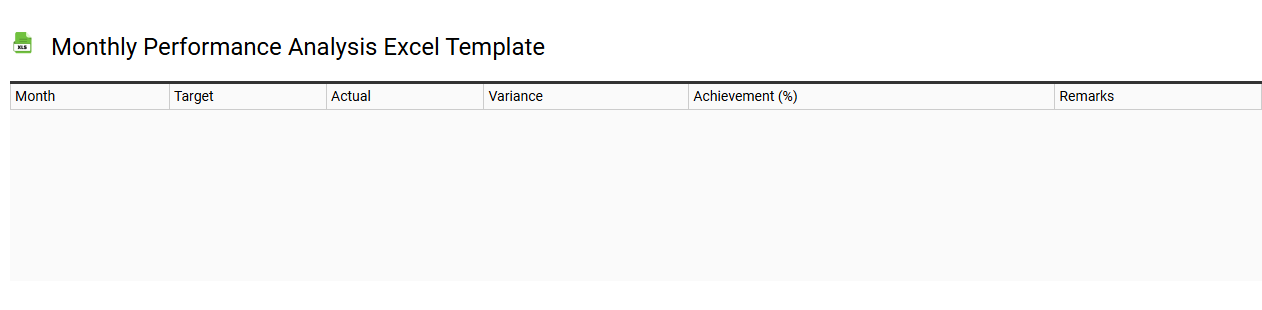
💾 Monthly performance analysis Excel template template .xls
A Monthly Performance Analysis Excel template is a structured tool designed to help track and assess key performance indicators (KPIs) over a month. It typically includes sections for revenue, expenses, and various metrics relevant to your specific industry or business goals. Detailed graphs and charts can visualize trends, making it easier for you to identify patterns and areas needing improvement. Basic usage includes entering data each month, while further potential needs could involve advanced analytical methods such as regression analysis or predictive modeling to enhance decision-making.