Discover a selection of free Excel templates specifically designed for creating Bubble charts. These templates streamline data visualization, allowing you to efficiently represent three data dimensions in a single chart. Each template is customizable, enabling you to input your data and generate informative, visually appealing charts tailored to your needs.
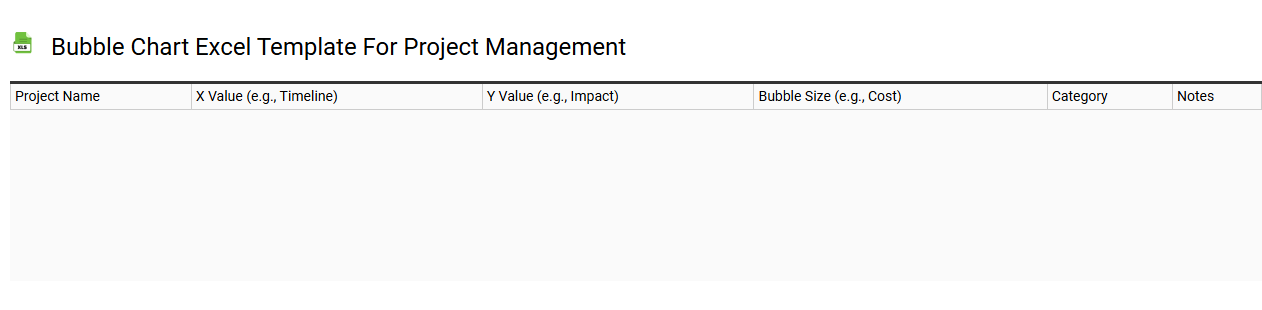
Bubble chart Excel template for project management
💾 Bubble chart Excel template for project management template .xls
A Bubble chart in Excel is a powerful visualization tool that represents three dimensions of data in a two-dimensional graph. Each circle, or "bubble," corresponds to a data point and its size reflects a third variable, allowing you to see the relationship between the X-axis and Y-axis values while grasping the magnitude of a third value. This makes it ideal for project management, where you can visualize project timelines, budget allocations, and resource efficiency simultaneously. For basic usage, you might track project performance metrics, while more advanced applications could incorporate risk assessment and strategic planning dimensions.
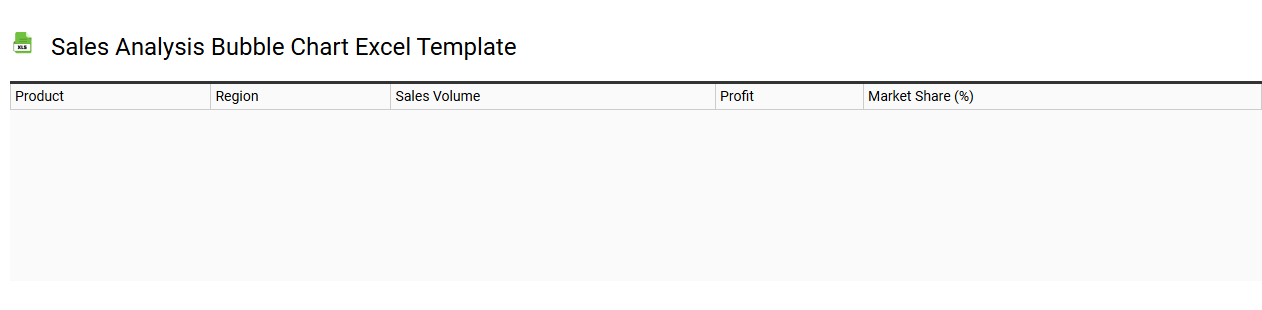
Sales analysis bubble chart Excel template
💾 Sales analysis bubble chart Excel template template .xls
A Sales Analysis Bubble Chart Excel template visually organizes sales data, showcasing individual sales performance and trends through the use of bubbles. Each bubble represents a single data point, where the position on the X and Y axes corresponds to different variables such as sales volume and revenue. The size of the bubble signifies an additional metric, like profit margin or market share, allowing for quick comparisons across different categories. This versatile tool assists you in identifying growth opportunities and areas needing attention, paving the way for more advanced analytics like predictive modeling or segmentation analysis.
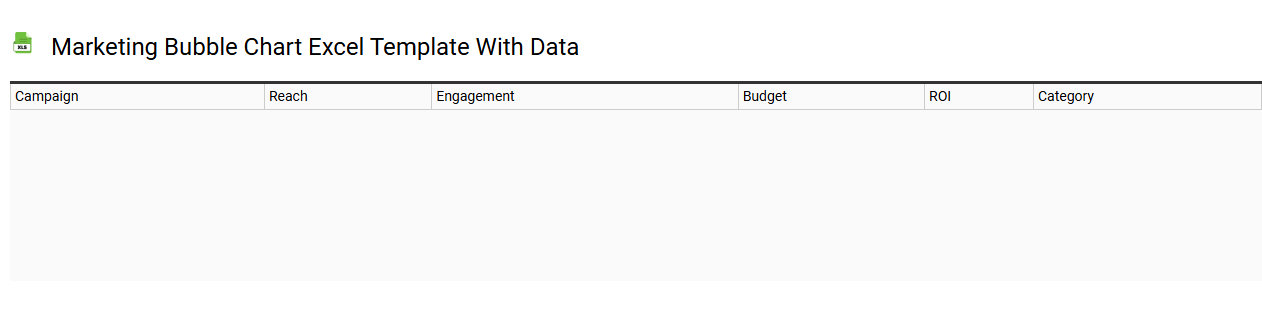
Marketing bubble chart Excel template with data
💾 Marketing bubble chart Excel template with data template .xls
A marketing bubble chart Excel template is a visual tool used for representing data points in a two-dimensional space, where each point is displayed as a bubble. The position of each bubble is determined by two data variables, typically representing different marketing metrics or dimensions, while the size of the bubble reflects a third variable, such as market share or budget allocation. This chart allows you to quickly visualize relationships and trends within your data, making it easier for you to identify opportunities or areas that need improvement. By utilizing this template, you can enhance your marketing strategies, and as you delve deeper, consider incorporating advanced features like dynamic filtering and predictive analytics for comprehensive insights.
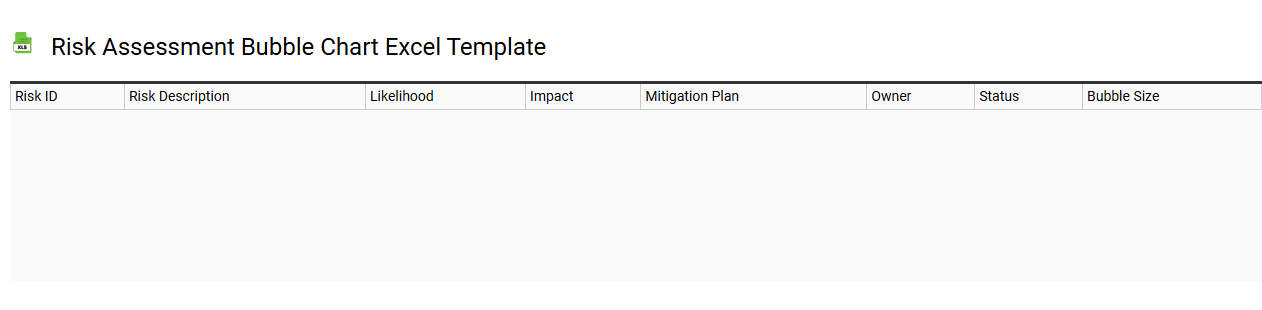
Risk assessment bubble chart Excel template
💾 Risk assessment bubble chart Excel template template .xls
A Risk Assessment Bubble Chart Excel Template visually represents various risks associated with a project or process, allowing you to analyze and prioritize them effectively. Each bubble signifies a specific risk, with its size reflecting the potential impact and its position indicating the likelihood of occurrence. This dynamic tool enables you to quickly identify high-priority risks that require immediate attention, streamlining your decision-making process. You can use this template for basic risk evaluation, while advanced applications include integrating it with predictive analytics or risk mitigation strategies.
Performance review bubble chart Excel template
💾 Performance review bubble chart Excel template template .xls
A performance review bubble chart Excel template visually represents individual or team performance metrics using bubbles that differ in size, color, and position. Each bubble corresponds to an employee or department, with the position on the chart indicating two key performance indicators, such as productivity and engagement levels. The size of each bubble represents a third dimension, like project impact or tenure at the organization, allowing for at-a-glance comparisons. This tool enhances your ability to pinpoint high performers and identify areas needing improvement, while also providing a clear basis for discussions about development, training plans, and potential leadership roles.
Financial data analysis bubble chart Excel template
💾 Financial data analysis bubble chart Excel template template .xls
A Financial Data Analysis Bubble Chart Excel template visually represents the relationships between multiple financial variables. Each bubble signifies a data point, with its position determined by two key financial metrics, while the size of the bubble indicates a third metric, such as revenue or market cap. This type of chart enables you to swiftly assess trends and identify outliers within complex datasets. You can utilize this template for basic analysis or expand your skills by incorporating advanced statistical techniques and machine learning models.
HR employee evaluation bubble chart Excel template
💾 HR employee evaluation bubble chart Excel template template .xls
The HR employee evaluation bubble chart Excel template is a visual tool designed to simplify employee performance assessments. This template allows you to represent multiple evaluation criteria, such as productivity, teamwork, and communication skills, in a single, easily interpretable chart, where each bubble's size represents the level of performance. Colors can differentiate various employee groups or departments, giving you a clear visual overview. With basic usage, you can track employee progress, while further potential needs might include integrating advanced analytics for predictive performance modeling.
Real estate investment bubble chart Excel template
💾 Real estate investment bubble chart Excel template template .xls
A real estate investment bubble chart Excel template visually represents data related to the real estate market, displaying different properties or investments in a clear, impactful manner. Each bubble corresponds to a specific investment, with the size of the bubble indicating variables such as price or potential return on investment, while positioning on the chart illustrates additional metrics like risk levels or historical performance. This template enables you to identify trends and make informed decisions based on visual data interpretations, enhancing your investment strategies. Basic usage involves inputting your property data; further potential needs may include advanced analytics like predictive modeling or machine learning techniques for deeper insights and forecasting.
Interactive bubble chart Excel template
💾 Interactive bubble chart Excel template template .xls
An interactive bubble chart Excel template serves as a dynamic visual tool for displaying three dimensions of data in a single graph, where each bubble's position represents two numeric values, while the size of the bubble conveys a third value. You can effectively compare and analyze complex datasets, highlighting correlations and trends among variables. Users benefit from customizable features, allowing adjustments to colors, labels, and data points for better readability and aesthetic appeal. Basic usage might involve showcasing sales data, but further potential needs could include incorporating advanced analytics with machine learning insights or real-time data integration.
Financial data bubble chart Excel template
💾 Financial data bubble chart Excel template template .xls
A Financial Data Bubble Chart Excel template is a specialized visual tool designed to represent three dimensions of data in a single chart, effectively communicating complex financial information. Each bubble in the chart corresponds to a specific data point, with its position representing two variables (x and y axes) while the size conveys a third variable, often signifying magnitude or importance. This type of visualization helps you identify trends, correlations, and outliers within your financial datasets, making analysis more intuitive. With basic usage for financial analysis, you can explore further potential needs like integrating advanced analytics, forecasting, or multi-dimensional analysis to derive deeper insights.
Dynamic bubble chart Excel template
💾 Dynamic bubble chart Excel template template .xls
A Dynamic Bubble Chart Excel template provides a visual representation of data that incorporates three dimensions: the x-axis, y-axis, and bubble size. Each bubble represents a data point, allowing you to observe relationships and trends among multiple variables simultaneously. This type of chart is particularly useful for displaying large datasets, where you can quickly identify patterns or outliers. You can utilize this template for basic data visualization needs, while more advanced applications might involve integrating real-time data feeds or utilizing Python code for enhanced interactivity and analytics.
3D bubble chart Excel template
💾 3D bubble chart Excel template template .xls
A 3D bubble chart Excel template visually represents data points in a three-dimensional format, where each bubble's position indicates two dimensions, and its size represents a third variable. Users can easily customize the template by inputting their own data sets, adjusting bubble colors, and modifying axis labels to enhance clarity and appearance. This type of chart is particularly useful for displaying relationships among several data series, allowing you to identify patterns and trends at a glance. Basic usage includes plotting sales figures against profit margins and product categories, while further potential applications could involve multidimensional analyses incorporating advanced statistical models.
Marketing analysis bubble chart Excel template
💾 Marketing analysis bubble chart Excel template template .xls
A Marketing analysis bubble chart Excel template visually represents data, showcasing the relationships between three different variables through the use of bubbles. Each bubble's position on the chart indicates values on the X and Y axes, while the bubble size correlates with a third variable, adding depth to your analysis. This powerful tool helps in identifying market trends, segment performance, and customer behaviors, allowing for more informed strategic decisions. You can utilize basic features to create compelling visuals for presentations, while further potential needs might include advanced analytics techniques like machine learning algorithms for predictive insights.
Editable bubble chart Excel template
💾 Editable bubble chart Excel template template .xls
An editable bubble chart Excel template is a predefined format in Microsoft Excel that allows users to create a bubble chart with ease. This template typically includes placeholders for your data, such as the X and Y coordinates, along with bubble sizes that visually represent additional dimensions, like values or categories. Users can easily customize colors, labels, and layouts to suit their specific data visualization needs, ensuring clarity and engagement. You can use this template for basic data presentations, and with further adjustments, apply advanced concepts like dataset clustering or multi-dimensional analysis.
Clustered bubble chart Excel template
💾 Clustered bubble chart Excel template template .xls
A clustered bubble chart template in Excel displays three-dimensional data using bubbles to represent points on a graph, where the size and position of each bubble relate to variables. Each bubble's position along the X and Y axes indicates two dimensions of data, while its size reveals a third dimension, enhancing data visualization. This format allows you to compare multiple categories, highlighting relationships and trends among different data points effectively. You can customize this template to suit various analytical needs, from basic data presentation to advanced statistical analysis involving regression models and multivariate data studies.
Bubble chart Excel template with data labels
💾 Bubble chart Excel template with data labels template .xls
A Bubble Chart Excel template is a specialized tool that allows you to visualize data points across three dimensions using circles, or "bubbles." Each bubble represents a data point, with its size indicating an additional variable while the position along the X and Y axes displays two other variables. You can enhance readability and comprehension by adding data labels, which provide context for each bubble, such as names or values associated with the data points. This template is highly versatile, enabling basic data presentation or more complex analytical tasks such as trend analysis, correlation studies, and market segmentation.
KPI tracking bubble chart Excel template
![]()
💾 KPI tracking bubble chart Excel template template .xls
A KPI tracking bubble chart Excel template is a visual tool designed to help you monitor and analyze key performance indicators (KPIs) across various metrics. It displays data points as bubbles on a two-dimensional grid, where the position and size of each bubble represent different variables, such as performance level and volume. This format allows for quick visual comparisons and helps identify trends, outliers, and correlations among the KPIs you are tracking. For basic usage, you might leverage it to assess sales performance, while advanced needs could involve integrating machine learning algorithms to predict future trends based on historical data.