Explore a collection of free XLS templates specifically designed for regression analysis in Excel. These templates include structured layouts for inputting data, clearly labeled sections for independent and dependent variables, and automatic calculation of regression coefficients. You'll find built-in charts for visualizing results, making it easy to interpret your data and enhance your analytical skills.
Regression analysis Excel template for multiple variables
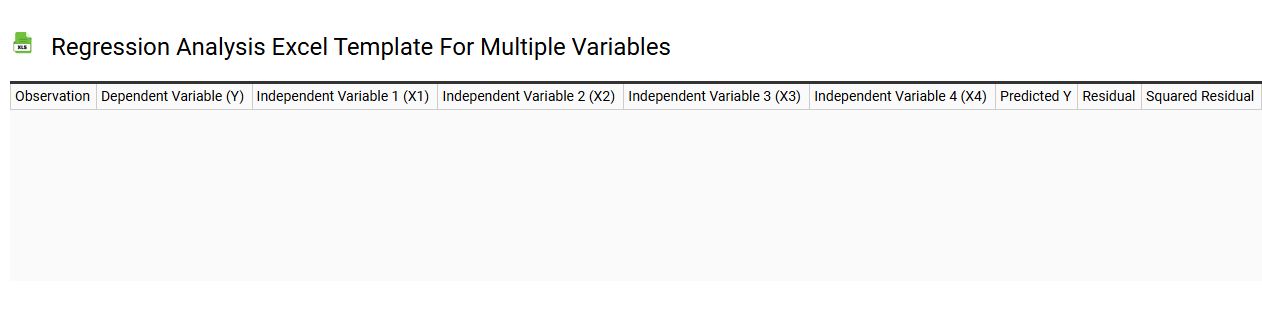
💾 Regression analysis Excel template for multiple variables template .xls
A regression analysis Excel template for multiple variables enables you to investigate the relationship between one dependent variable and two or more independent variables. You can input your data into designated cells, and the template often includes built-in functions to calculate coefficients, intercepts, and statistical metrics like R-squared values. This tool streamlines the process of visualizing correlations and can generate scatter plots, which assist in understanding how your variables interact. You may find this template useful for basic predictive modeling, and it can be further expanded for advanced machine learning applications or complex data analytics.
Linear regression analysis Excel template
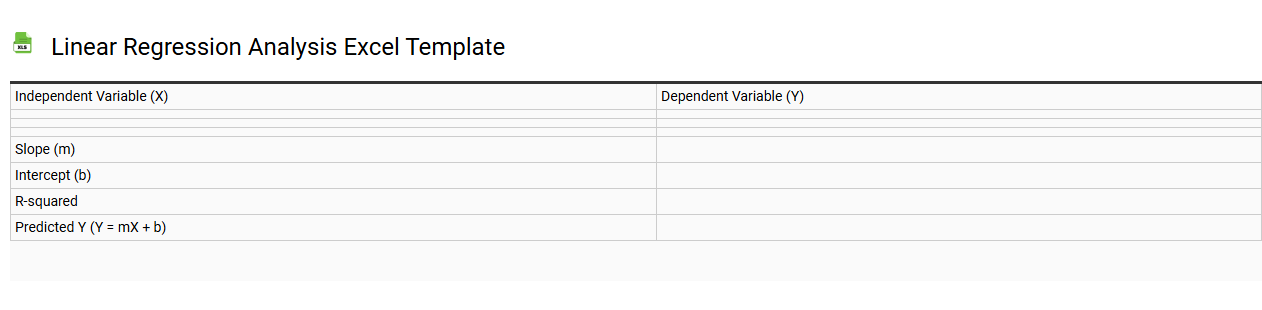
💾 Linear regression analysis Excel template template .xls
A Linear Regression Analysis Excel template is a pre-designed spreadsheet that simplifies the process of conducting linear regression analysis, allowing users to analyze the relationship between dependent and independent variables. This template typically includes sections for inputting data, visualizing results through charts, and calculating key statistics such as R-squared values and coefficients. Users can easily manipulate their data within the template, ensuring a streamlined workflow for both beginners and more experienced analysts. Beyond basic usage for forecasting trends, this template can also facilitate advanced needs such as multivariate regression or polynomial regression modeling for deeper insights.
Regression analysis Excel template with scatter plot
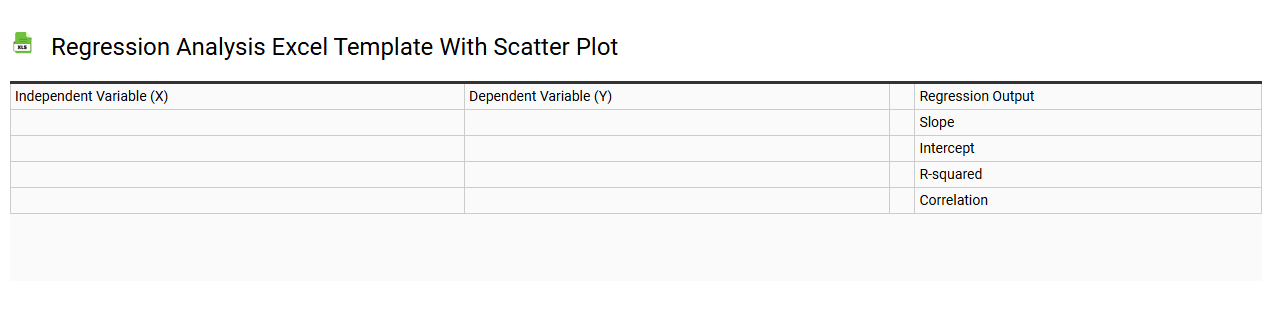
💾 Regression analysis Excel template with scatter plot template .xls
A Regression Analysis Excel template with a scatter plot visually represents the relationship between two variables. This template allows you to input your data and quickly generate a scatter plot, where each point represents an observation. The trend line, derived from the regression analysis, helps to predict outcomes based on the data points' correlation. You can use this tool for basic statistical analysis or explore advanced concepts such as multiple regression or polynomial regression, depending on your needs.
Simple regression analysis Excel template
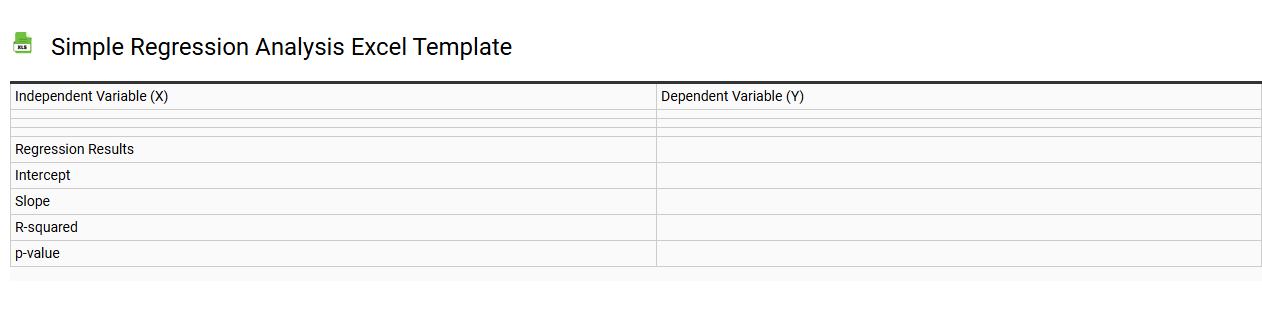
💾 Simple regression analysis Excel template template .xls
A Simple Regression Analysis Excel template streamlines the process of examining the relationship between two variables, allowing users to predict outcomes easily. This template typically includes fields for inputting data, generating scatterplots, and calculating the regression equation. Visual insights are provided through charts, making it easier for you to grasp the correlation and how one variable influences another. While basic usage suffices for many applications, advanced analyses using multiple regression techniques or residual analysis can further enhance your understanding and model accuracy.
Polynomial regression analysis Excel template
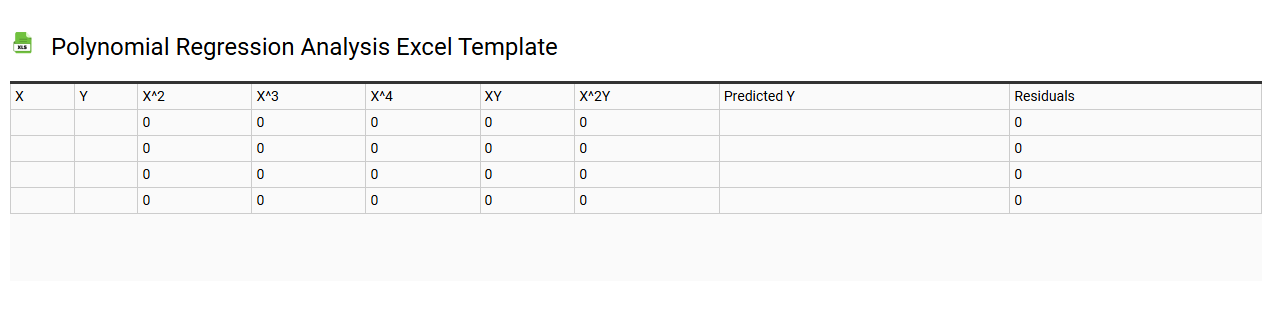
💾 Polynomial regression analysis Excel template template .xls
Polynomial regression analysis in an Excel template provides a structured approach to fitting a polynomial equation to a dataset, demonstrating relationships where the effects are not linear. This template includes sections for inputting your raw data, adjusting polynomial degrees, and visualizing the regression curve alongside your scatter plot. Users can easily manipulate the degree of the polynomial, offering flexibility in modeling complex datasets. Further potential needs may involve advanced techniques such as multiple polynomial regression or spline fitting for nuanced data analysis.
Multiple regression analysis Excel template free download
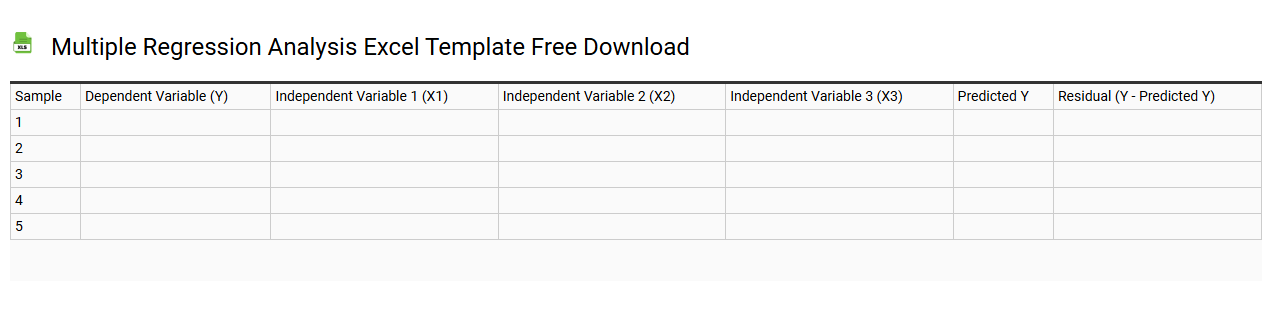
💾 Multiple regression analysis Excel template free download template .xls
A Multiple Regression Analysis Excel template simplifies the process of analyzing relationships between multiple independent variables and a dependent variable. This user-friendly tool provides pre-set formulas and data input sections, allowing you to enter your data easily and interpret the results effectively. Comprehensive graphs and tables illustrate correlations, helping you visualize and understand complex data relationships. While basic usage involves conducting simple analyses, this template can also be expanded to accommodate more intricate statistical needs, such as incorporating interaction terms or polynomial regression.
Regression analysis Excel template for business forecasting
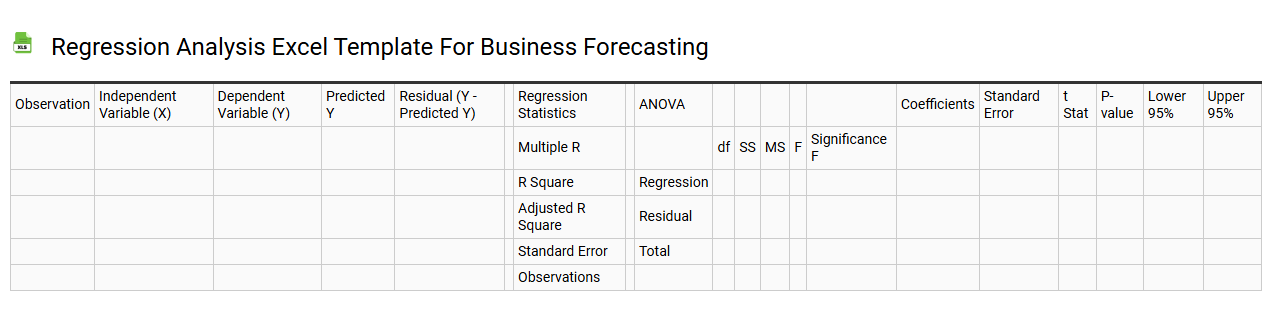
💾 Regression analysis Excel template for business forecasting template .xls
A regression analysis Excel template for business forecasting serves as a powerful tool for predicting future trends based on historical data. It allows you to input various independent variables that influence a dependent variable, such as sales or revenue. This template typically includes built-in formulas that automate the calculation of coefficients, R-squared values, and standard errors, making the analysis more efficient. By leveraging this tool, you can gain insights into potential sales forecasts, inventory needs, and market trends, setting the stage for more advanced needs such as multiple regression or time series analysis.
Regression analysis Excel template for students
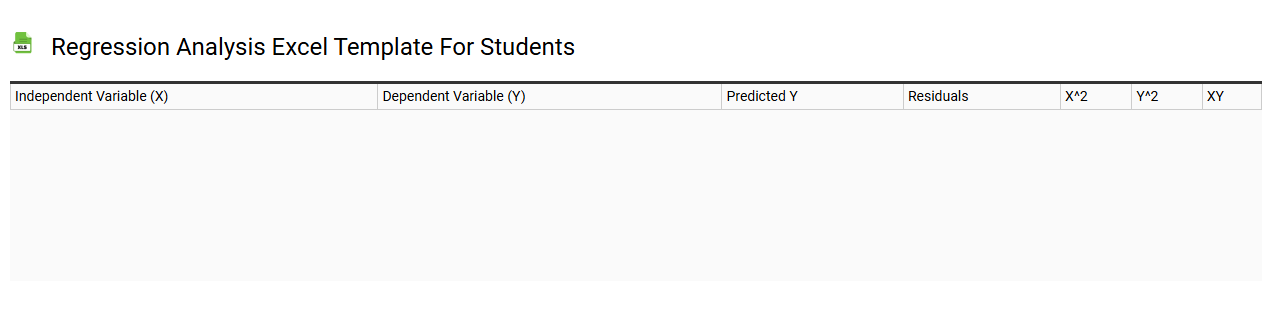
💾 Regression analysis Excel template for students template .xls
A Regression Analysis Excel template for students serves as a guided framework for conducting statistical regression analyses using Excel. It typically includes predefined sections for entering data, specified variables, and output results such as regression coefficients, R-squared values, and residual plots. Users can visualize relationships between dependent and independent variables effectively through built-in charts and graphs. This tool not only simplifies the basic regression process but also lays the groundwork for advanced techniques like multiple regression or logistic regression, catering to more complex data analysis needs.
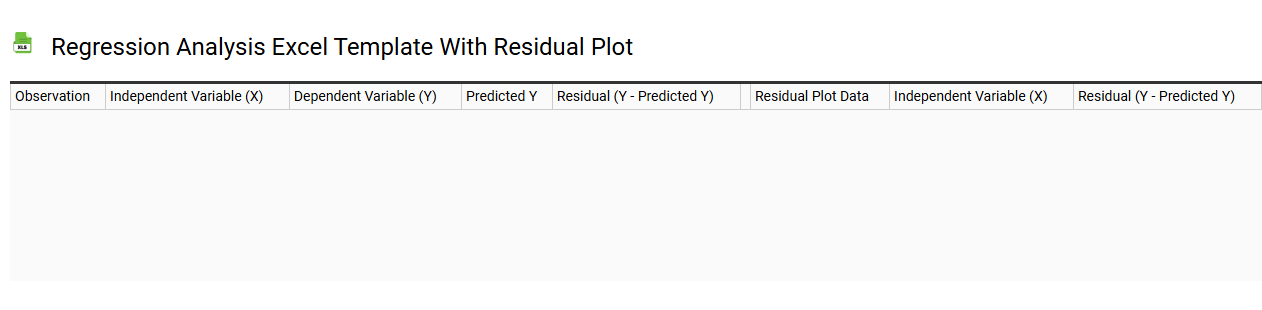
Regression analysis Excel template with residual plot
💾 Regression analysis Excel template with residual plot template .xls
A regression analysis Excel template with a residual plot provides a structured way to perform regression analysis while visually assessing model accuracy. This template typically includes sections for inputting independent and dependent variables, calculating regression coefficients, and generating statistical summaries. The residual plot offers a graphical representation of the residuals, which helps identify patterns or anomalies that may indicate a poor fit or the presence of outliers. Utilizing this template, you can easily analyze relationships, assess model performance, and explore advanced topics such as multicollinearity and heteroscedasticity.
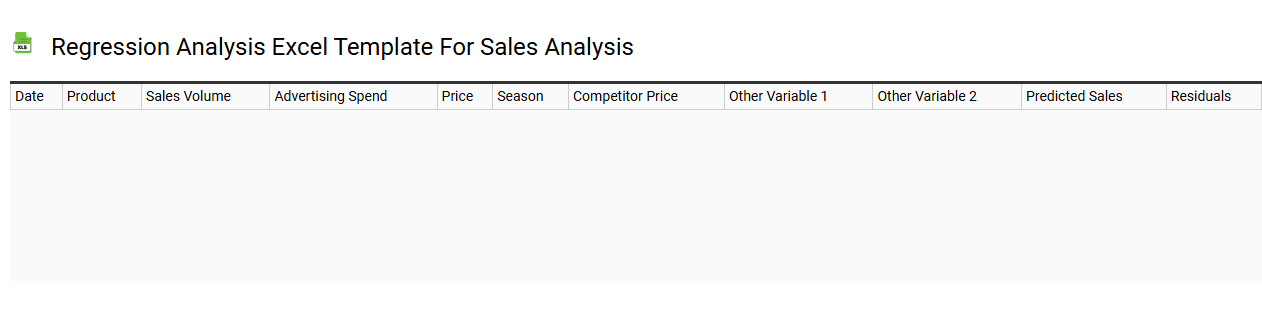
Regression analysis Excel template for sales analysis
💾 Regression analysis Excel template for sales analysis template .xls
A Regression analysis Excel template for sales analysis is a structured framework that helps in evaluating the relationship between sales and various influencing factors like price, advertising spend, or seasonality. This template typically includes sections for inputting your sales data alongside independent variables, and it employs built-in Excel functions to perform calculations and generate statistical outputs. Visual aids such as scatter plots or trend lines enhance data interpretation, allowing you to identify patterns and make informed decisions. You can utilize this template for basic trend analysis and expand into advanced forecasting techniques like multiple regression or time series analysis, should your data needs evolve.