Explore a range of free XLS templates designed for comparing income and expenses effectively. These templates typically feature easy-to-read charts that visually represent your financial data, allowing you to identify trends and make informed decisions. Each template is customizable, enabling you to input your figures and track your financial health seamlessly over time.
Income versus expenses chart Excel template with monthly breakdown
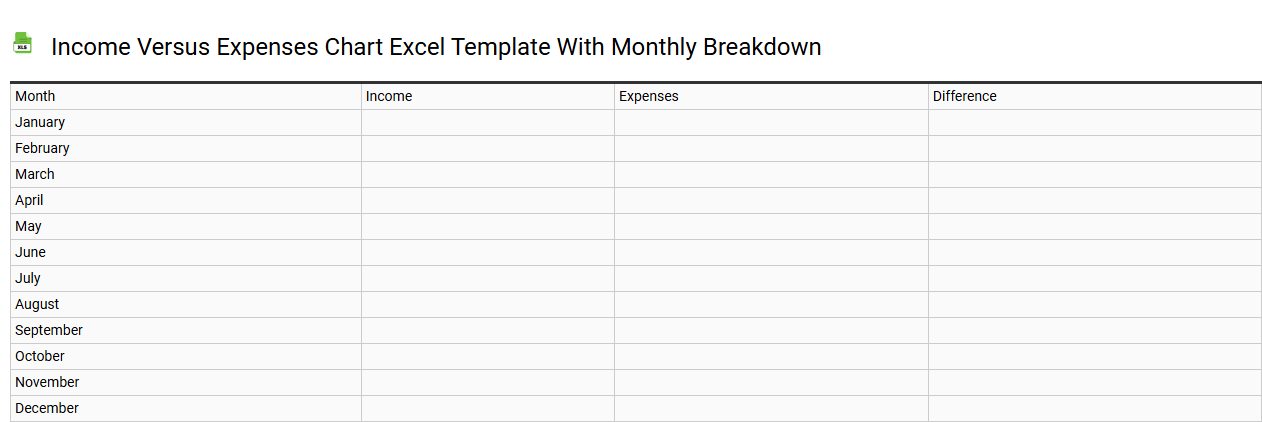
💾 Income versus expenses chart Excel template with monthly breakdown template .xls
An Income versus Expenses chart in Excel provides a clear visual representation of your financial health by comparing your earnings to your expenditures over a specified period. Each month features distinct data points, allowing for easy identification of trends, such as months where expenses exceed income. The chart typically includes categories for different income sources and expense types, facilitating better budgeting and financial planning. This tool can help you track financial performance and analyze spending habits, while advanced usage might involve incorporating pivot tables or forecasting models to enhance financial predictions.
Detailed income versus expenses chart Excel template for budgeting
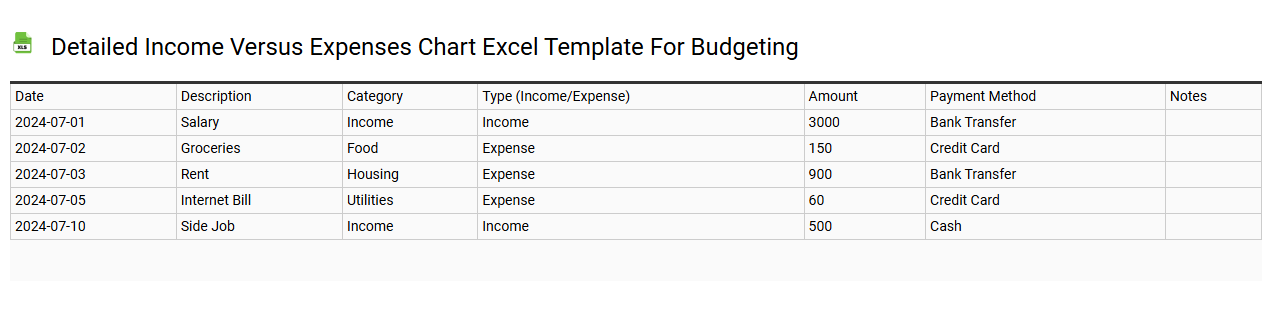
💾 Detailed income versus expenses chart Excel template for budgeting template .xls
A Detailed Income versus Expenses chart Excel template is a powerful tool for managing your finances. This structured layout allows you to systematically categorize your income sources alongside your various expenses, providing a clear visual comparison. You can track specific income types like salaries, bonuses, and investment returns while simultaneously documenting fixed and variable expenses, including rent, utilities, and discretionary spending. With this template, you gain insights into your budgeting habits, enabling you to identify areas for improvement and anticipate future financial needs, such as optimizing savings goals and analyzing cash flow for investments or advanced financial forecasting.
Personal income versus expenses chart Excel template for families
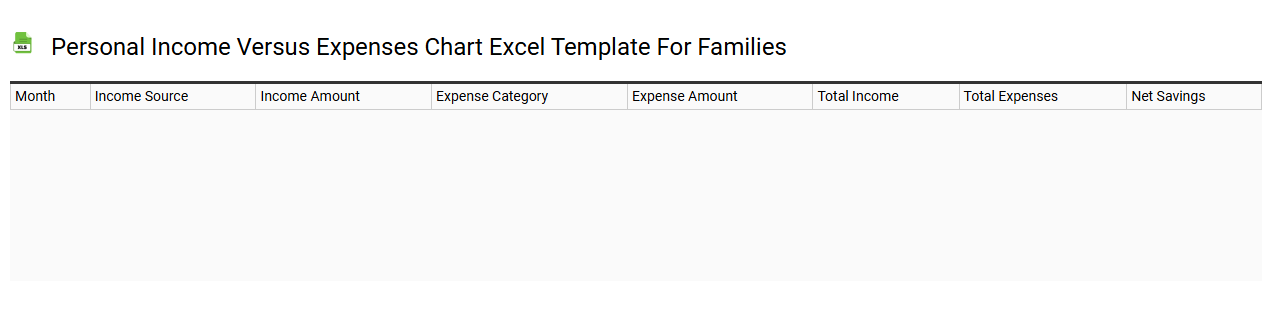
💾 Personal income versus expenses chart Excel template for families template .xls
A Personal Income versus Expenses chart Excel template for families provides a structured way to track and visualize household finances. This template typically includes sections for various income sources, such as salaries, freelance work, or rental income, alongside categories for expenses, including utilities, groceries, and entertainment. By inputting your data into the template, you gain insights into spending habits, allowing you to identify areas where you can cut costs or redirect funds into savings. Such a chart can easily evolve from basic tracking to incorporate advanced budgeting techniques like cash flow analysis or predictive financial modeling to help you meet future financial goals.
Annual income versus expenses chart Excel template
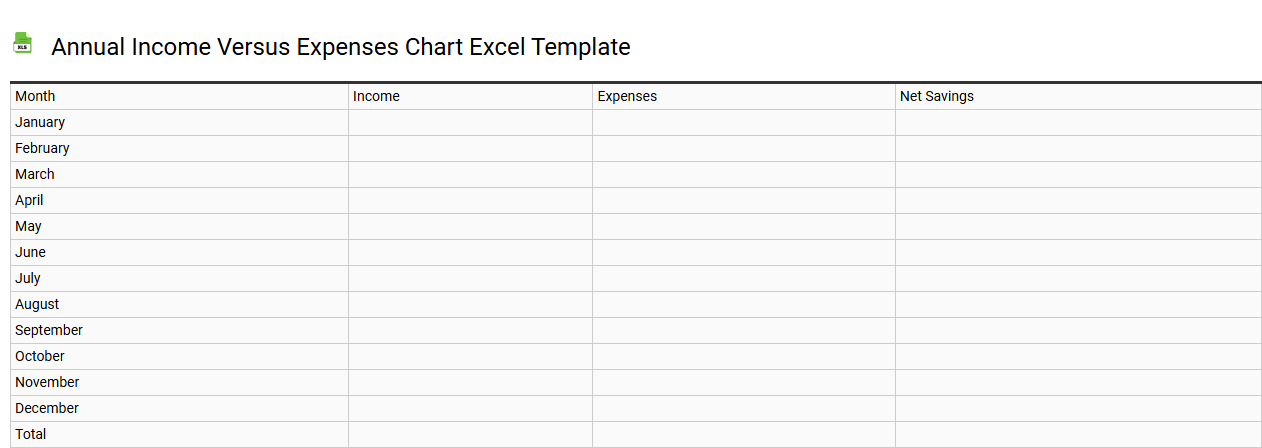
💾 Annual income versus expenses chart Excel template template .xls
An Annual Income versus Expenses chart in Excel provides a visual representation of your financial inflows and outflows over a year. This chart typically includes categories such as salary, investments, bills, groceries, and entertainment, displaying them side by side for easy comparison. You can quickly identify trends, evaluate spending habits, and spot areas for potential savings. Such a chart serves as a foundational tool for basic financial management while also allowing for advanced analysis using formulas or forecasting techniques for future budgeting needs.
Simple income versus expenses chart Excel template with categories
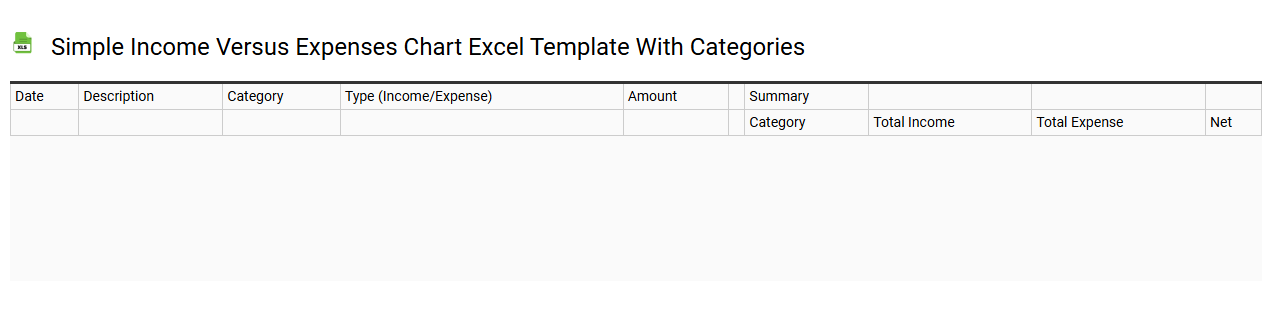
💾 Simple income versus expenses chart Excel template with categories template .xls
A Simple Income versus Expenses chart Excel template provides a structured framework for tracking your finances. It typically includes categorized sections for income sources, such as salary, freelance work, or investments, alongside various expense categories like housing, transportation, and entertainment. This visual representation allows you to easily compare your total income against your total expenses, highlighting areas where you may overspend. Utilizing this template can support basic budgeting, while further potential needs could involve more advanced financial modeling and forecasting techniques like cash flow analysis or variance reporting.
Income versus expenses chart Excel template with automatic calculations
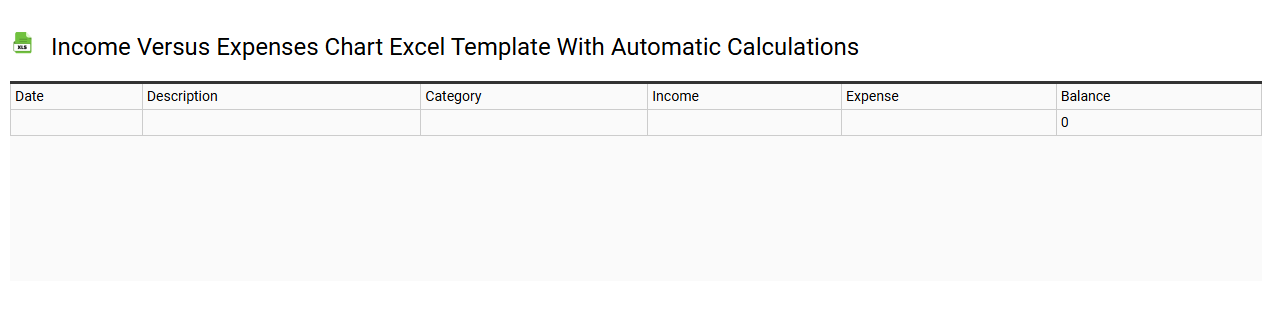
💾 Income versus expenses chart Excel template with automatic calculations template .xls
An Income versus Expenses chart Excel template is a powerful financial tool that enables you to visualize the relationship between your income and expenses over specific periods. This template typically features a user-friendly interface, where you can input your income sources and various expenses, allowing the automated calculations to update your financial status in real-time. The visual representation, such as bar graphs or pie charts, provides a clear overview of your financial health, making it easier for you to identify trends and make informed decisions. You can further customize the template to include advanced features like forecasting, budget planning, and scenario analysis, enhancing your financial management capabilities.
Income versus expenses chart Excel template for small businesses
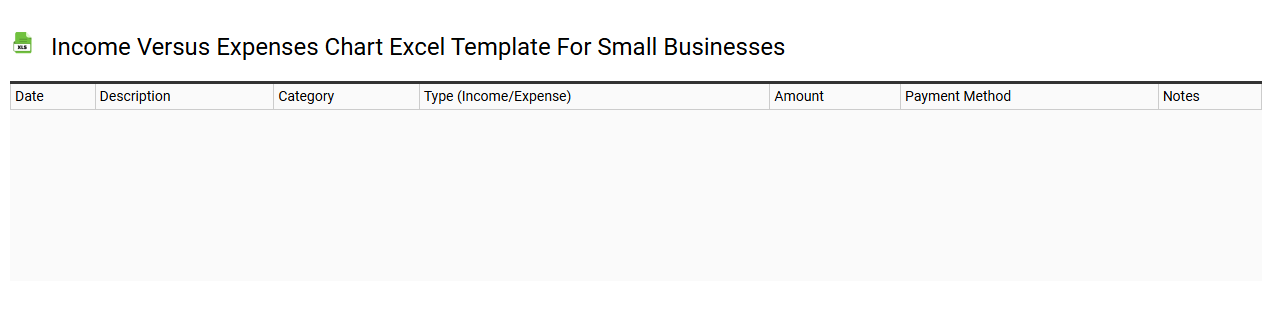
💾 Income versus expenses chart Excel template for small businesses template .xls
An Income versus Expenses chart Excel template for small businesses visually compares your revenue to your expenditures over a specified period. This tool typically includes columns for income categories, such as sales and services, alongside expense categories like rent, salaries, and utilities. Each entry is represented graphically, allowing you to quickly identify trends and discrepancies. Such templates not only facilitate basic tracking but can also evolve into complex financial analyses, integrating advanced features like forecasting and variance analysis.
Free income versus expenses chart Excel template download

💾 Free income versus expenses chart Excel template download template .xls
A Free Income versus Expenses Chart Excel template visually represents your financial inflow and outflow, helping you track your earnings against your expenditures. This template typically includes pre-formatted sections for entering income sources, such as salary or freelance work, alongside categories for various expenses like rent, groceries, and entertainment. Using this chart allows you to quickly identify trends, ensuring you stay within your budget and make informed financial decisions. You can further customize this template to include advanced features like cash flow projections and variance analysis for deeper insights into your financial health.
Income versus expenses chart Excel template with graphs and charts
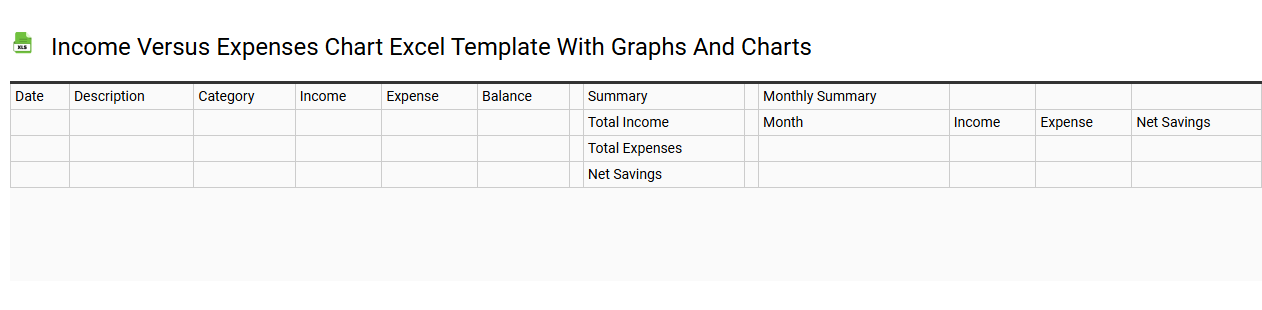
💾 Income versus expenses chart Excel template with graphs and charts template .xls
An Income versus Expenses chart in an Excel template visually represents your financial inflow and outflow. This chart highlights a clear comparison between income streams and expense categories, allowing you to identify trends and patterns over time. By using graphs such as bar charts or line graphs, you can easily discern fluctuations in your finances, helping you make informed budgeting decisions. Beyond basic tracking, further analysis could involve sophisticated forecasting models and scenario planning for future financial strategy.
Income versus expenses comparison Excel template
💾 Income versus expenses comparison Excel template template .xls
An Income versus Expenses comparison Excel template is a powerful tool designed to help you track and manage your financial health. It visually represents your total income against your various expenses, enabling you to identify trends, patterns, and areas for improvement in your budget. The template typically includes predefined categories for income sources, such as salary, investments, or side gigs, and expenses like rent, utilities, and groceries. By utilizing this template, you can easily analyze your cash flow, anticipate future spending, and make informed financial decisions, paving the way for advanced budgeting techniques or investment strategies.
Income versus expenses analysis Excel template
💾 Income versus expenses analysis Excel template template .xls
An Income versus Expenses analysis Excel template is a structured spreadsheet designed to help you track and visually compare your earnings against your expenditures. This tool typically features customizable sections for various income sources and different categories of expenses, allowing for a comprehensive overview of your financial health. Graphs and charts often accompany the data, providing visual insights on trends over time, highlighting areas where spending may exceed income. You can utilize this template for basic budgeting needs, and it can be expanded to include advanced financial modeling scenarios such as forecasting, variance analysis, and scenario planning.
Income versus expenses monthly tracker Excel template
![]()
💾 Income versus expenses monthly tracker Excel template template .xls
An Income versus Expenses monthly tracker Excel template visually compares your monthly income with your expenses, allowing for effective financial management. This template features distinct columns for various income sources, such as salary, side jobs, or investments, alongside detailed categories for expenses like rent, groceries, and entertainment. You can easily input your figures to generate insightful charts that illustrate your financial health over time. For basic usage, this tool meets immediate budgeting needs, while further potential lies in integrating advanced functions like projections and financial forecasting models.
Income versus expenses dashboard Excel template
💾 Income versus expenses dashboard Excel template template .xls
An Income versus Expenses dashboard Excel template visually tracks your financial performance by comparing total revenue against total expenditures. The layout typically features charts and graphs, enabling you to quickly assess your financial health at a glance. You can customize categories for income sources like salary, investments, or freelance work while detailing expenses related to housing, utilities, and discretionary spending. This template serves as a foundational tool for personal budgeting, with potential for advanced features such as forecasting models and automated data integration for deeper insights.
Income versus expenses chart generator Excel template
💾 Income versus expenses chart generator Excel template template .xls
An Income versus Expenses chart generator Excel template visually represents your financial data, allowing you to track your earnings and expenditures in an organized manner. You can easily input your income sources, such as salary, investments, and freelance work, alongside various expense categories like rent, utilities, and groceries. The chart dynamically updates as data is added, providing a clear view of your financial health over time. This template can help you identify trends, manage your budget effectively, and explore advanced financial concepts like cash flow forecasting and break-even analysis.
Income versus expenses yearly summary Excel template

💾 Income versus expenses yearly summary Excel template template .xls
An Income versus Expenses yearly summary Excel template is a comprehensive tool designed to track and analyze your financial performance over the year. This template visually presents your income sources alongside your expenses, allowing for easy comparison and identification of spending patterns. You can input various categories, such as salary, investments, and operational costs, enabling a clearer view of your financial health. This resource not only helps in basic budgeting but can also assist in forecasting future needs, accommodating advanced functions like pivot tables and complex financial modeling.
Income versus expenses visual report Excel template
💾 Income versus expenses visual report Excel template template .xls
An Income versus Expenses visual report Excel template serves as a powerful tool for tracking financial performance over a specific period. The template typically features a user-friendly layout with charts and graphs, clearly representing your income streams and expenditures. Color-coded sections enhance readability, allowing for quick identification of trends and areas needing attention. This type of report not only helps you stay on top of your budget but also sets the stage for further financial analysis through advanced functions like forecasting, variance analysis, and scenario modeling.
Income versus expenses breakdown Excel template
💾 Income versus expenses breakdown Excel template template .xls
An Income versus Expenses breakdown Excel template is a powerful tool designed to help you manage your financial performance effectively. This template allows you to input your income sources, such as salaries, freelance work, or rental income, alongside your expenses, including housing, utilities, groceries, and entertainment. By visualizing your financial data through spreadsheets, you can quickly identify trends, track your spending habits, and spot areas for potential savings. You can utilize this basic template for straightforward budgeting, while more advanced features like pivot tables or scenario analysis can cater to complex financial planning needs.
Income versus expenses chart with categories Excel template
💾 Income versus expenses chart with categories Excel template template .xls
An Income versus Expenses chart in Excel visually represents the financial data of various categories, helping you track your earnings against your spending. This template includes distinct categories such as salary, freelance income, fixed expenses, variable expenses, and savings. By inputting your monthly data into this pre-formatted chart, you can quickly assess areas where you might be overspending. For further insights, you can enhance the template with advanced features like pivot tables, dynamic charts, or automated financial forecasting tools.
Income versus expenses automatic calculator Excel template
💾 Income versus expenses automatic calculator Excel template template .xls
The Income versus Expenses automatic calculator Excel template is a powerful tool designed to help you track and manage your financial activities effectively. This template allows you to input your income sources and various expenses, providing a clear overview of your financial health through visually appealing charts and tables. Customizable categories enable you to tailor the template to your specific needs, helping you identify trends and areas for improvement in your budget management. Basic usage includes monitoring monthly cash flow, while advanced features may involve integrating forecasting models or detailed variance analysis for more comprehensive financial planning.