Explore a diverse selection of free Excel templates designed specifically for stock price charts. These templates facilitate easy tracking of stock performance over time, allowing you to input data seamlessly and visualize trends through various chart styles. With features including customizable graphs and built-in formulas, you can analyze stock fluctuations and make more informed investment decisions.
Stock price chart Excel template for daily tracking
![]()
💾 Stock price chart Excel template for daily tracking template .xls
A Stock price chart Excel template for daily tracking provides a structured format for monitoring stock price movements over time. This customizable template allows users to input daily stock prices, specifying the date, opening price, closing price, high, low, and volume traded. Visual components like line graphs and candlestick charts can be integrated to enhance data interpretation, making it easier for users to observe trends and patterns. You can further enhance this template with advanced features like technical indicators, moving averages, and risk assessment models for a comprehensive analysis of your stock portfolio.
Historical stock price analysis Excel template
💾 Historical stock price analysis Excel template template .xls
A Historical Stock Price Analysis Excel template serves as a powerful tool for investors and analysts to evaluate the performance of stocks over time. It allows users to input stock prices, trading volumes, and relevant dates, enabling detailed tracking of price trends and patterns. With built-in formulas and data visualization features, users can create charts and graphs that highlight key metrics, such as moving averages and volatility indexes, fostering data-driven decision-making. This template can help you understand basic investment strategies or explore advanced concepts like technical analysis and portfolio optimization.
Stock price movement Excel template with graphs
💾 Stock price movement Excel template with graphs template .xls
Stock price movement Excel templates with graphs allow you to visualize the fluctuating prices of stocks over a defined period. These templates typically include line charts that depict price trends, bar graphs to compare daily or weekly movements, and sometimes even candlestick charts for in-depth analysis of market behavior. The data input usually consists of dates, stock prices, and volume, making it easy to track performance and identify patterns. Such templates can enhance your understanding of financial trends and support more advanced features like technical analysis indicators.
Stock price comparison Excel template

💾 Stock price comparison Excel template template .xls
A Stock Price Comparison Excel template is a versatile tool designed for investors to evaluate and contrast the prices of different stocks over a specified period. This template typically includes columns for stock symbols, historical prices, percentage changes, and relevant financial ratios. You can easily input data to generate visual charts and graphs, enabling a clearer understanding of stock performance trends. Basic usage involves tracking stock prices, while more advanced features may include predictive analytics and integration with real-time market data feeds.
Stock price trends Excel template for investors
💾 Stock price trends Excel template for investors template .xls
A Stock Price Trends Excel template for investors visually represents historical stock price data against time intervals, showcasing trends and fluctuations. This template typically includes features like price charts, moving averages, and volume indicators, allowing you to conduct technical analysis easily. Customizable cells enable you to input data specific to your investment portfolio, enhancing your analytical capabilities. You can also integrate complex formulas and advanced charting options for deeper insights, accommodating further potential needs like predictive analytics or machine learning integrations.
Dividend and stock price tracking Excel template
![]()
💾 Dividend and stock price tracking Excel template template .xls
A Dividend and stock price tracking Excel template helps you monitor the performance of your investments in real-time. It typically includes features such as charts to visualize price changes, tables for recording dividend payments, and formulas for calculating total return on investment. You can easily input stock symbols and relevant data, allowing for efficient tracking of multiple securities in one place. This tool serves not only basic investment tracking needs but can also assist in advanced portfolio management strategies, such as quantitative analysis and optimal asset allocation.
Multi-company stock price Excel template
💾 Multi-company stock price Excel template template .xls
A Multi-company stock price Excel template is a pre-designed spreadsheet that enables users to track and analyze the stock prices of various companies simultaneously. This template typically includes features such as automatic data updates, customizable charts, and performance comparisons among selected stocks. By integrating formulas and functions, it allows you to calculate important metrics like returns, volatility, and moving averages. Beyond basic tracking, users might explore advanced applications like portfolio optimization, trend analysis, and automated reporting.
Stock price forecasting Excel template
💾 Stock price forecasting Excel template template .xls
A Stock Price Forecasting Excel template serves as a powerful tool for investors and analysts, enabling them to project future stock prices based on historical data. It typically includes features like time series analysis, moving averages, and regression models, allowing for a deeper examination of stock trends. Your ability to customize the input variables, such as historical prices and economic indicators, enhances accuracy in predictions. Basic usage of this template can pave the way for more complex analyses, including advanced econometric modeling and machine learning algorithms for sophisticated forecasting scenarios.
Stock price chart Excel template free download
💾 Stock price chart Excel template free download template .xls
A stock price chart Excel template is a pre-designed spreadsheet that allows you to visually track and analyze the fluctuations of stock prices over time. This template typically includes features such as line graphs, bar charts, and data tables, making it easy to visualize trends and patterns in stock performance. You can enter historical prices, volume data, and other relevant financial metrics, providing insight into market behavior. For basic tracking of stock performance, this template is incredibly useful, but it can also be enhanced with advanced analytics tools like regression analysis and moving averages for deeper financial insights.
Historical stock price tracking Excel template
![]()
💾 Historical stock price tracking Excel template template .xls
A Historical stock price tracking Excel template serves as a tool for investors and financial analysts to monitor past stock prices and performance data over specific periods. This template typically includes essential features such as date, open price, close price, high and low values, and trading volume, allowing you to visualize trends and patterns easily. You can customize it further by incorporating charts or graphs for better data representation. Such a template can be a foundational asset for basic stock analysis, while more advanced users may explore features like automated data retrieval through APIs and integration with financial modeling tools.
Stock price analysis Excel template
💾 Stock price analysis Excel template template .xls
A Stock Price Analysis Excel template serves as a powerful tool for tracking and assessing stock performance over time. This template typically includes various data fields such as opening price, closing price, daily high, daily low, and trading volume. You can visualize stock trends through charts and graphs, which transform raw data into easily interpretable insights. In addition to basic price tracking, the template can be extended to calculate moving averages, analyze price volatility, and perform risk assessments through advanced financial metrics.
Daily stock price log Excel template
💾 Daily stock price log Excel template template .xls
A Daily Stock Price Log Excel template is a structured file designed for tracking and analyzing stock prices over time. This template usually includes columns for the stock's date, opening price, closing price, highest price, lowest price, and trading volume. Users can input daily stock data, enabling them to visualize trends and compute metrics such as average prices and percentage changes. This template is a valuable tool for both novice investors looking to monitor their investments and seasoned traders aiming for deeper analysis and forecasting.
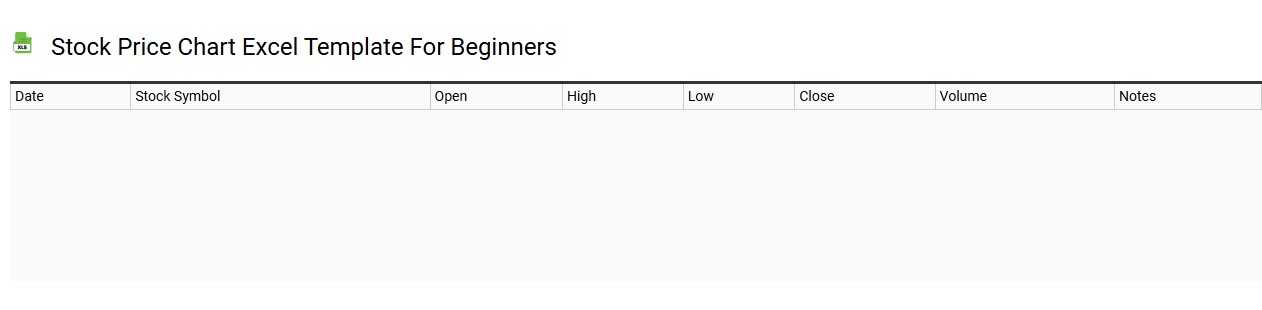
Stock price chart Excel template for beginners
💾 Stock price chart Excel template for beginners template .xls
A Stock price chart Excel template serves as a user-friendly tool for tracking and visualizing historical stock price movements. This template often includes features such as date ranges, opening and closing prices, volume of trades, and graphical representations like line or candlestick charts. Beginners can easily input their desired stock data to create dynamic charts that help interpret market trends and make informed investment decisions. This basic Excel tool can potentially evolve into more sophisticated analyses, incorporating advanced techniques such as regression analysis and financial forecasting.
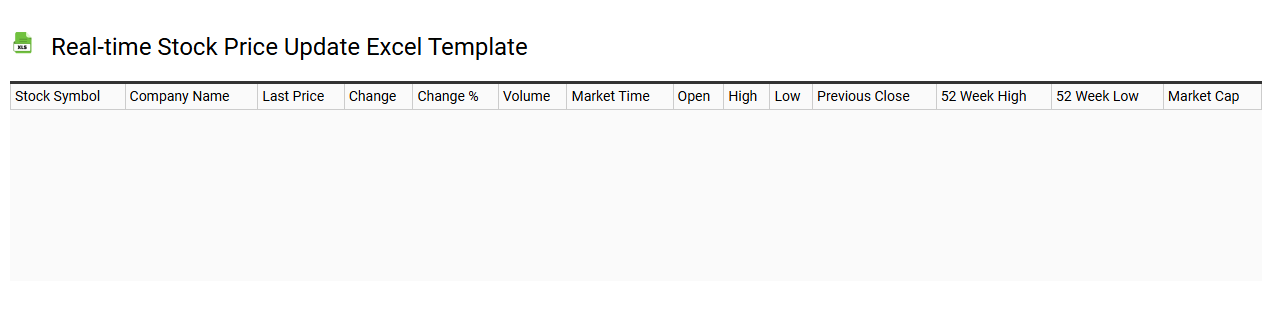
Real-time stock price update Excel template
💾 Real-time stock price update Excel template template .xls
A Real-time stock price update Excel template is a powerful tool designed to help investors and traders monitor stock prices as they fluctuate throughout the trading day. It seamlessly integrates with financial data sources to pull live market data directly into your spreadsheet, enabling you to track multiple stock tickers, current prices, percentage changes, and other vital metrics instantly. This template often includes features like conditional formatting, customizable charts, and automated calculations, enhancing your ability to analyze market trends quickly. You can use this template for basic portfolio tracking or expand its functionality to include advanced analyses such as technical indicators or automated trading strategies.
Stock price movement tracker Excel template
![]()
💾 Stock price movement tracker Excel template template .xls
A Stock Price Movement Tracker Excel template is a customizable spreadsheet designed to help you monitor and analyze the fluctuations in stock prices over time. It typically includes features such as historical price data, percentage changes, and performance metrics, allowing you to visualize trends and make informed investment decisions. You can input your preferred stocks and track daily, weekly, or monthly price movements, comparing them against market indices or peer stocks. This tool can serve basic analytical needs, while further potential applications may incorporate advanced financial modeling, algorithmic trading strategies, and real-time data integration.
Stock price portfolio tracker Excel template
![]()
💾 Stock price portfolio tracker Excel template template .xls
A stock price portfolio tracker Excel template is a customizable tool designed to help you monitor and manage your investments in the stock market. This template typically includes columns for stock symbols, purchase prices, current prices, number of shares owned, and overall portfolio value, allowing you to track your gains and losses at a glance. Features such as automatic calculations and charts can provide visual insights into performance trends, making it easier to make informed investment decisions. As your investment strategy evolves, you may find the need to incorporate more advanced analytics, such as risk assessment models and predictive algorithms.
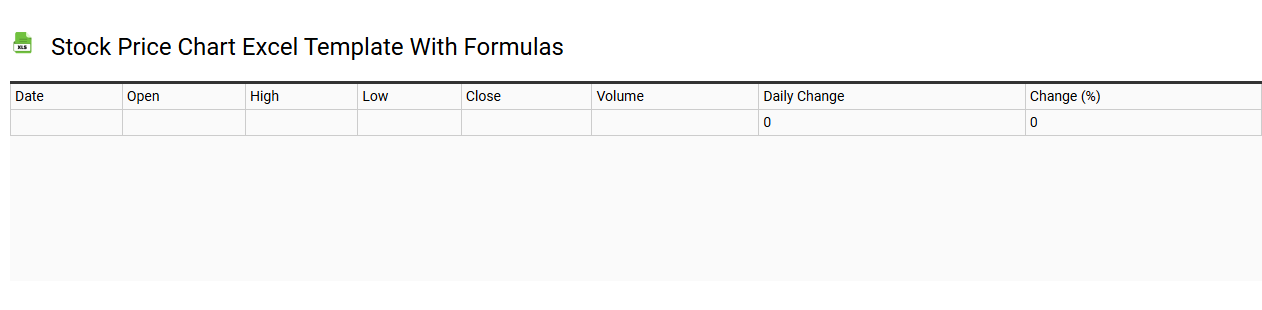
Stock price chart Excel template with formulas
💾 Stock price chart Excel template with formulas template .xls
A Stock price chart Excel template with formulas is a pre-designed spreadsheet that allows you to track and visualize stock prices over time. This template typically includes columns for the date, opening price, closing price, high, low, and volume of shares traded, integrating formulas that calculate essential metrics like daily price changes and moving averages. You can create clear visual representations using built-in charting tools, enabling efficient analysis of stock performance trends. For personalized financial tracking or deeper analysis, you might consider incorporating advanced features like predictive modeling or technical indicators.