Explore a variety of free XLS templates specifically designed for creating pie charts in Excel. These templates provide pre-designed layouts, making it easy for you to visualize data trends and proportions effectively. Each template is customizable, allowing you to input your data directly and adjust colors to fit your branding or presentation needs.
Pie chart Excel template for sales analysis
💾 Pie chart Excel template for sales analysis template .xls
A Pie Chart Excel template for sales analysis visually represents the contribution of each product or category to total sales. With distinct segments colored uniquely, this chart allows you to quickly identify top-performing products, enabling data-driven decisions. Data labels can enhance clarity by displaying percentages or values for each slice, ensuring you grasp the sales distribution at a glance. This basic template can be tailored for advanced analytics, such as integrating interactive features or connecting to real-time data sources for in-depth trend analysis.
Monthly expense pie chart Excel template
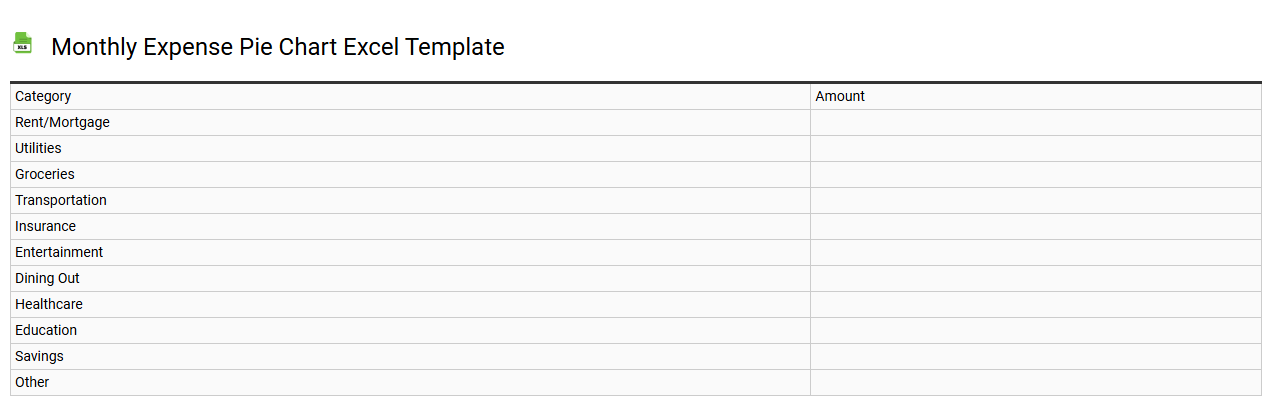
💾 Monthly expense pie chart Excel template template .xls
A Monthly Expense Pie Chart Excel template visually represents your spending habits, allowing you to easily track and categorize expenses. It typically includes sections for various categories such as housing, groceries, transportation, entertainment, and utilities, displayed as colorful segments within the pie chart. As you input your monthly expenses, the chart dynamically updates to reflect your financial distribution, helping you to identify areas where you can cut costs. This basic tool can be expanded to include advanced budgeting features like trend analysis, forecasting, and financial projections for more strategic planning.
Business budget pie chart Excel template
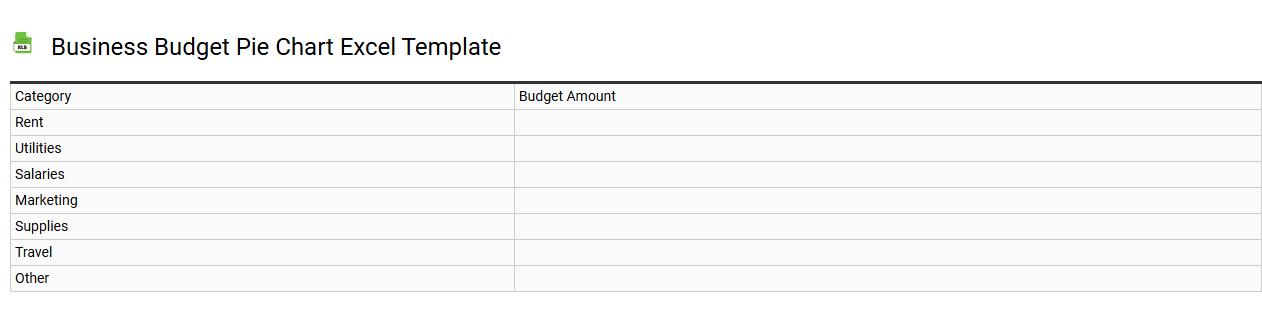
💾 Business budget pie chart Excel template template .xls
A Business Budget Pie Chart Excel template visually represents your business's financial allocations across different categories, such as marketing, operations, payroll, and overhead costs. Each segment of the pie chart illustrates the percentage of the total budget dedicated to various expenses, making it easy for you to grasp where your funds are being spent. This tool enhances financial analysis by providing clarity and facilitating comparisons between budgeted and actual expenditures. Advanced users can customize this template further to include data forecasting, variance analysis, and scenario planning features, maximizing its utility for complex financial strategies.
Pie chart Excel template for project management
💾 Pie chart Excel template for project management template .xls
A pie chart Excel template for project management visually represents data distribution in a project, helping you identify the proportions of various components or tasks. Each slice corresponds to a specific project element, such as phases, team responsibilities, or resource allocations, allowing for easy comparison and analysis. Using this template enhances your ability to communicate project progress and resource utilization to stakeholders effectively. Understanding the basic usage of this template can pave the way for more advanced analyses, such as incorporating data-driven insights or predictive analytics for future project planning.
Pie chart Excel template for financial statements
💾 Pie chart Excel template for financial statements template .xls
A Pie Chart Excel template for financial statements visually represents data, making it easier to analyze financial distributions at a glance. Each slice of the pie illustrates a different component of financial data, such as expenses, revenues, or profits, highlighting the proportion each category contributes to the whole. This template enables you to input your financial figures, and it automatically generates a clear and professional-looking pie chart. For basic usage, you can track expenditures efficiently, while advanced features could allow you to incorporate dynamic datasets for multispectral financial analysis.
Marketing campaign pie chart Excel template
💾 Marketing campaign pie chart Excel template template .xls
A Marketing campaign pie chart Excel template visually represents the distribution of different marketing strategies or budget allocations within a campaign, allowing you to identify which areas are receiving the most focus. Each segment of the pie chart corresponds to specific data points, such as categories like social media, email marketing, or content creation, enabling you to quickly assess the effectiveness of your initiatives. You can easily customize these templates with your own data, ensuring that the visualization aligns with your campaign objectives and metrics. Utilizing such tools aids in not only presenting current marketing efforts but also in strategizing for future campaigns, including advanced analytics and ROI projections.
Employee distribution pie chart Excel template
💾 Employee distribution pie chart Excel template template .xls
An Employee Distribution Pie Chart Excel template visually represents the breakdown of employees across various departments or roles within an organization. This template allows you to easily input data, such as employee counts or percentages, transforming that information into a clear and engaging pie chart. You can customize colors, labels, and legends to enhance readability and presentation, ensuring that your audience can grasp the distribution at a glance. For basic usage, consider tracking general departmental sizes; however, it can be expanded to analyze employee demographics, skills mapping, or workload allocation for more advanced analytical needs.
Pie chart Excel template for customer segmentation
💾 Pie chart Excel template for customer segmentation template .xls
A pie chart Excel template for customer segmentation visually represents different customer groups based on various characteristics such as demographics, purchasing behavior, or preferences. Each segment of the pie chart corresponds to a specific category, making it easy for you to identify the proportion of each group within your overall customer base. Colors and labels enhance clarity, helping stakeholders quickly grasp the distribution of various segments. This tool not only aids in understanding current customer profiles but also lays the foundation for more advanced analytics like predictive modeling or behavioral analysis.
Pie chart Excel template for survey results
💾 Pie chart Excel template for survey results template .xls
A Pie chart Excel template for survey results visually represents data collected from surveys, displaying segments that illustrate the proportional relationships among various response categories. Each slice of the pie corresponds to a specific response, with its size reflecting the frequency or percentage of that response among the total. This format makes it easy for you to analyze results at a glance, helping to identify trends and preferences within the survey population. Beyond basic usage for simple data display, these templates can be customized with advanced features like dynamic data ranges and interactive dashboards for deeper analysis.
Product category pie chart Excel template
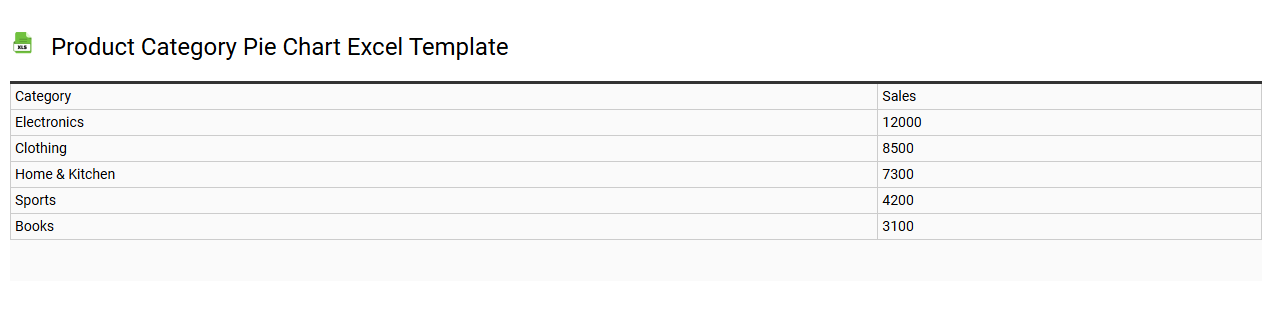
💾 Product category pie chart Excel template template .xls
A Product category pie chart Excel template visually represents the proportionate distribution of different product categories within a dataset. Each segment of the pie chart corresponds to a specific category, allowing for quick comparisons among products. The colors and labeling enhance clarity, making it easy for you to identify which categories dominate your product mix. This template serves as a foundational tool for basic data visualization, with opportunities for further potential applications like analyzing trends using advanced statistical techniques such as regression analysis or machine learning algorithms.