Explore a selection of free XLS templates for creating Profit and Loss charts in Excel, specifically designed to enhance your financial analysis. These templates provide a structured layout, allowing you to easily input revenue, expenses, and net income figures for any time period. With clear headings and organized sections, you're equipped to visualize your financial performance effectively.
Profit and loss statement Excel template for small business
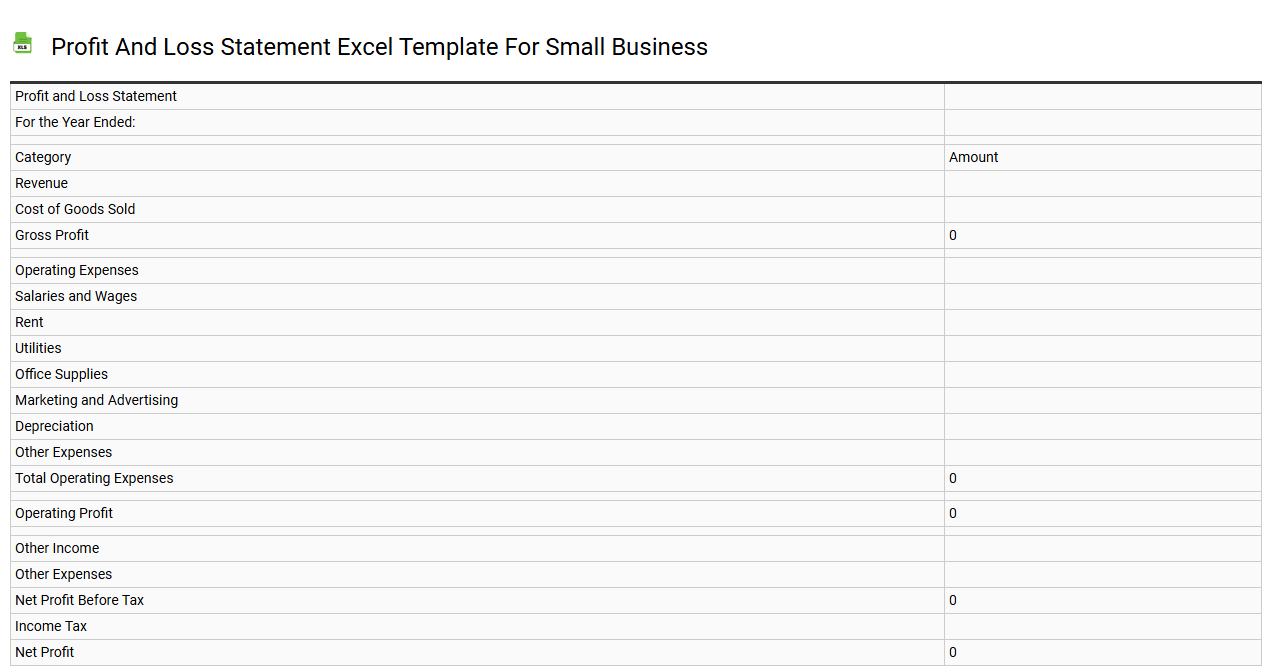
💾 Profit and loss statement Excel template for small business template .xls
A Profit and Loss (P&L) statement Excel template for small businesses serves as a financial tool that summarizes revenues, costs, and expenses over a specific period. It allows you to track your income sources, such as sales and services, along with all operational expenses, including salaries, rent, and utilities. The template provides a clear overview of net profit or loss by subtracting total expenses from total revenues, giving you insight into your business's financial health. Using this template can help you manage cash flow effectively and plan for future growth, while advanced users might explore adding features like trend analysis or forecasting models.
Monthly profit and loss chart Excel template
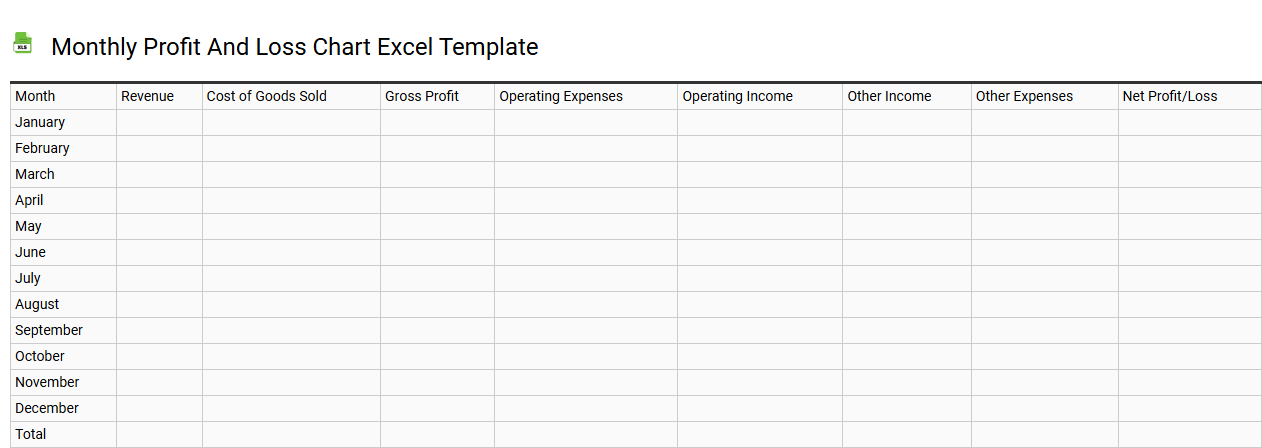
💾 Monthly profit and loss chart Excel template template .xls
A Monthly Profit and Loss Chart Excel template is a structured tool designed to help you track and analyze your business's financial performance over a specific period, typically on a monthly basis. This template visually displays income, expenses, and net profit, allowing for easy comparison across different months. Color-coded sections simplify the identification of trends, helping you make informed decisions about your financial strategies. Beyond basic financial tracking, advanced users can leverage this template for in-depth forecasting, variance analysis, or even integrating it with accounting software for comprehensive financial management.
Simple profit and loss Excel template for personal use
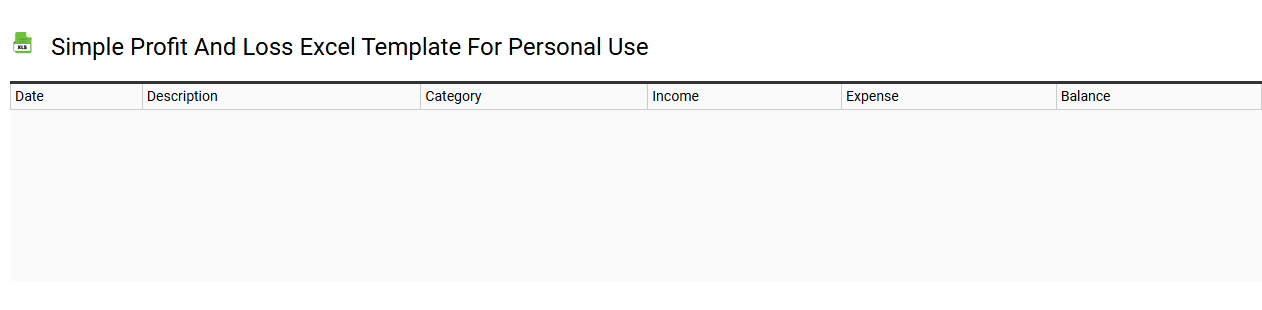
💾 Simple profit and loss Excel template for personal use template .xls
A Simple Profit and Loss Excel template is a straightforward tool designed to help you track income and expenses over a specified period. It typically includes sections for recording revenue sources, categorizing expenses, and calculating net profit or loss. This template is user-friendly, allowing you to input your financial data easily while providing clear visual representations of your financial health. You can use it for monthly budgeting, assessing overall performance, and identifying areas for improvement, with further potential for integration with advanced financial analysis tools like pivot tables and scenario forecasting.
Yearly profit and loss report Excel template
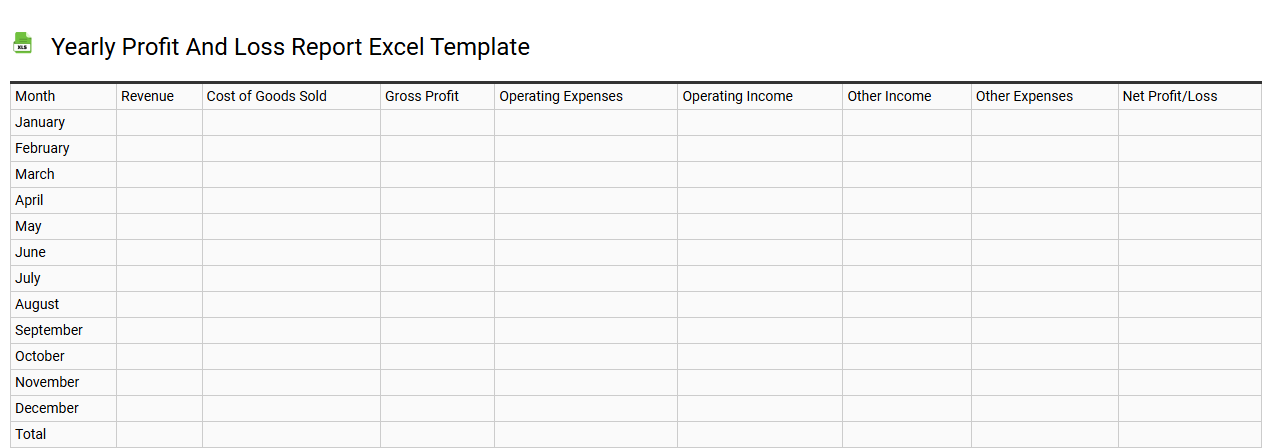
💾 Yearly profit and loss report Excel template template .xls
A Yearly Profit and Loss Report Excel template is a structured spreadsheet designed to help businesses track their financial performance over an entire year. This template includes various sections such as revenue, expenses, and net profit, allowing users to input their financial data easily. Utilizing formulas, it automatically calculates totals and provides insights into profitability trends and operational efficiency. This tool can meet your basic accounting needs, while advanced users might explore integrating dynamic dashboards or using pivot tables for deeper financial analysis.
Restaurant profit and loss chart Excel template
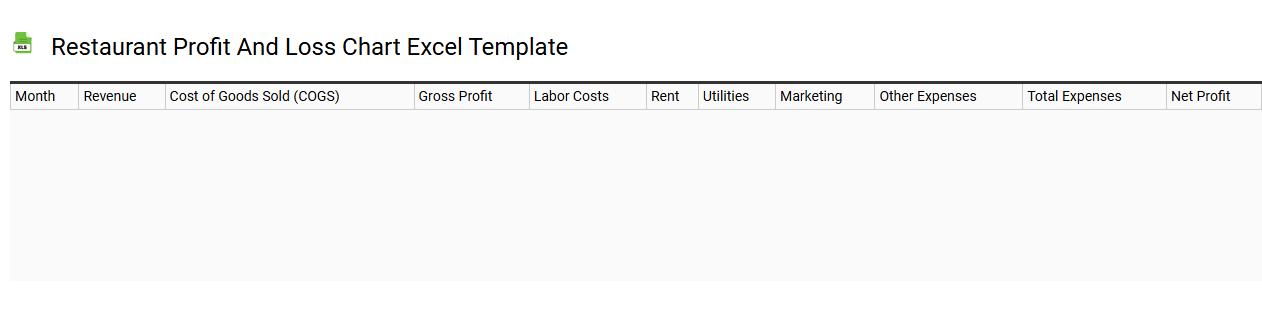
💾 Restaurant profit and loss chart Excel template template .xls
A Restaurant Profit and Loss (P&L) chart Excel template provides a detailed view of the financial health of a restaurant. It systematically tracks revenue streams such as food and beverage sales, alongside operational costs including labor, rent, and inventory. By visualizing data, the template enables you to analyze monthly or quarterly performances, helping in identifying trends and areas for improvement. You can pivot from basic tracking to advanced financial modeling, exploring potential needs like forecasting and cash flow analysis.
Profit and loss Excel template with graphs
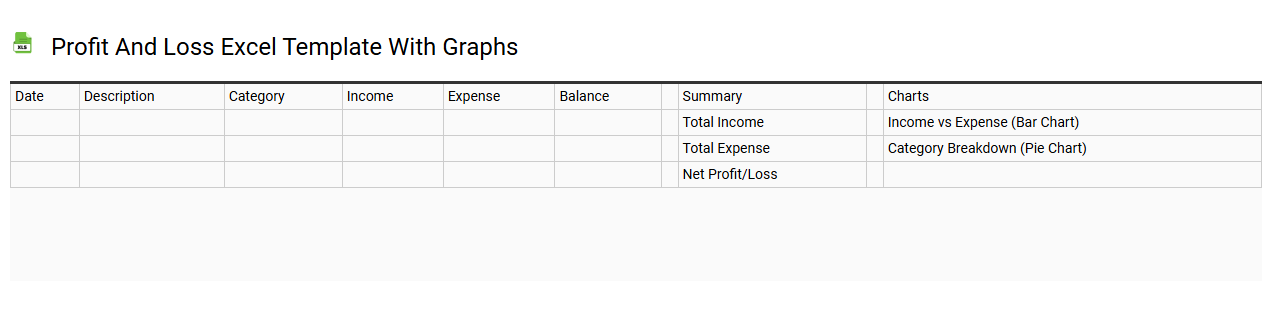
💾 Profit and loss Excel template with graphs template .xls
A Profit and Loss Excel template with graphs provides a visual representation of your financial performance over a specific period. This template typically includes a clear breakdown of revenues, expenses, and net profit or loss, allowing you to track your business's financial health effectively. Graphs within the template illustrate trends, making it easier to identify patterns in your income and expenditures. You can utilize this template for basic financial analysis while considering advanced options like pivot tables and forecasting models for more comprehensive insights.
Automated profit and loss Excel template free download
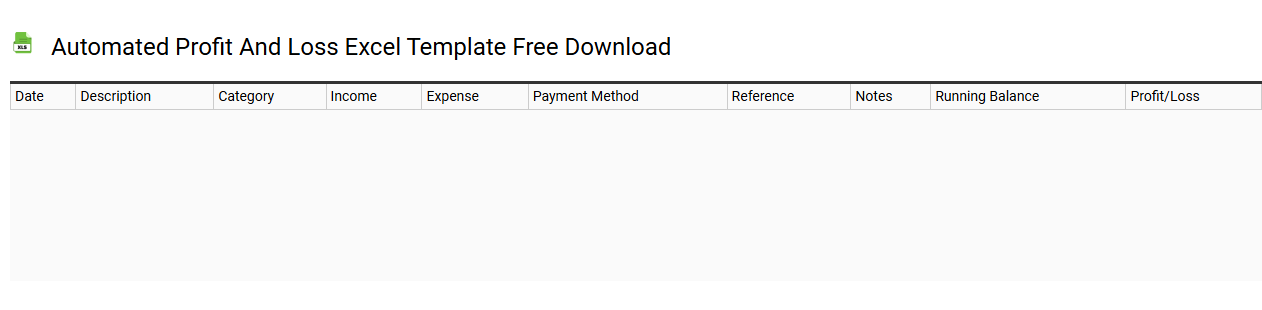
💾 Automated profit and loss Excel template free download template .xls
An Automated Profit and Loss (P&L) Excel template serves as a dynamic financial tool that tracks your income and expenses effortlessly. It allows you to input various revenue streams and costs, automatically calculating your profit or loss over specific periods. With features such as built-in formulas and customizable sections, you can tailor the template to your business needs. This resource simplifies your financial management and lays the groundwork for more advanced analyses, such as cash flow forecasting and variance analysis.
Profit and loss analysis Excel template with formulas
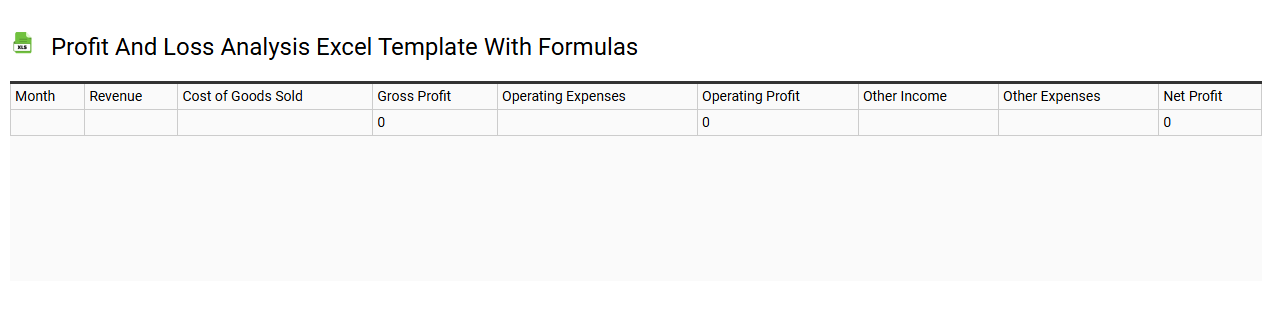
💾 Profit and loss analysis Excel template with formulas template .xls
A Profit and Loss Analysis Excel template serves as a structured tool to evaluate your financial performance over a specific period. It typically includes essential sections such as revenue, cost of goods sold, gross profit, operating expenses, and net profit, allowing you to track income and expenses systematically. Within the template, built-in formulas, such as SUM, AVERAGE, and IF, automate calculations, enhancing accuracy and saving time. This template can be customized for basic budgeting or expanded to include advanced analytics, such as forecasting and variance analysis, to suit your evolving financial monitoring needs.
Detailed profit and loss chart Excel template for startups
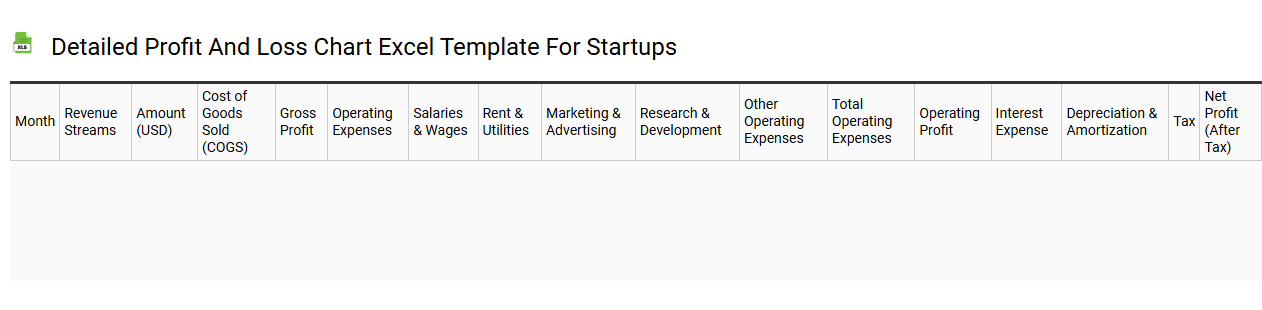
💾 Detailed profit and loss chart Excel template for startups template .xls
A detailed profit and loss chart Excel template for startups provides a structured framework for tracking income, expenses, and overall financial performance. It typically includes categories such as revenue streams, cost of goods sold, operating expenses, and net profit. Each section allows you to input specific figures, enabling real-time analysis of financial health and forecasting. This tool's fundamental purpose is to assist in budgeting and performance evaluation, while its advanced features can incorporate metrics like EBITDA and variance analysis for deeper insights.
Editable profit and loss Excel template for quick reporting
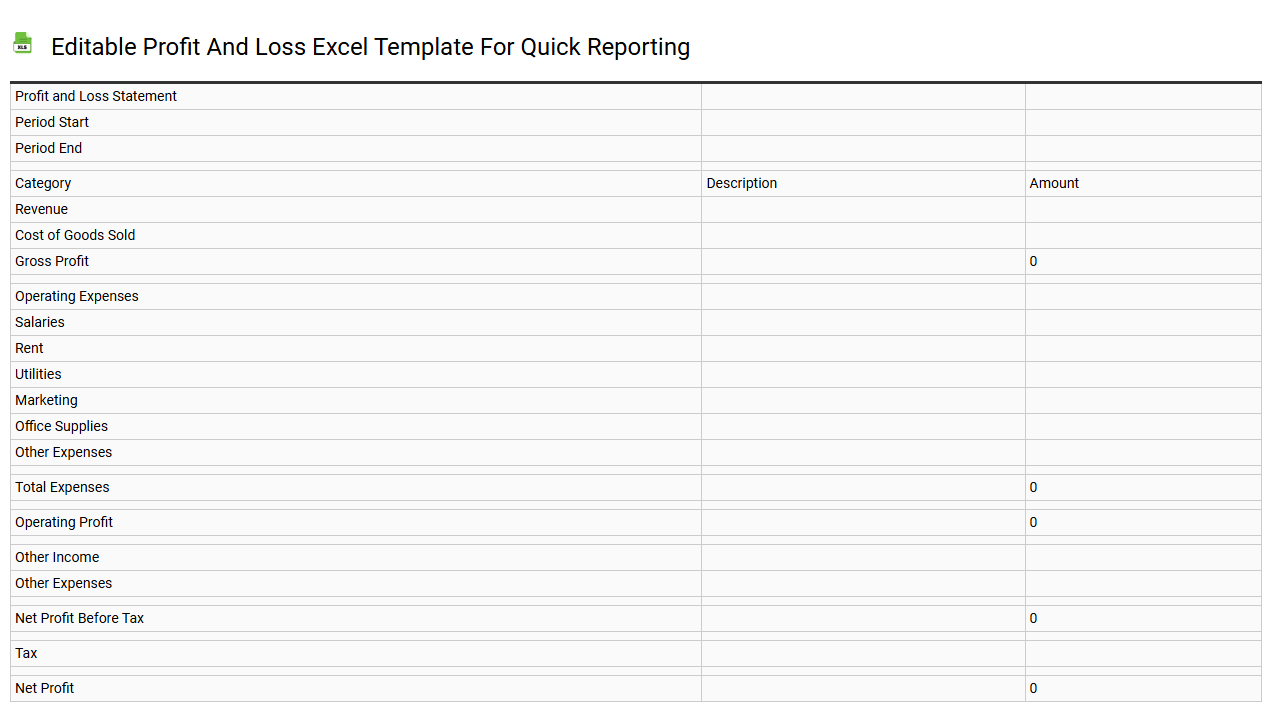
💾 Editable profit and loss Excel template for quick reporting template .xls
An editable profit and loss Excel template offers a structured format for tracking your income and expenses over a specific period. It provides clear sections for revenue, cost of goods sold, operating expenses, and net profit, making it easy to input your financial data. With customizable features, you can adjust categories and formulas to align with your business needs, enabling quick and efficient reporting. This tool not only serves basic budgeting needs but can also be adapted for more advanced financial analysis, such as forecasting and variance analysis, enhancing your overall financial strategy.