Explore a variety of free Excel templates designed specifically for creating grades charts. These templates come with pre-filled formulas and customizable sections, allowing you to easily input student names, subjects, and scores. With vibrant color schemes and clear layouts, you can efficiently track academic performance and visualize progress over time.
Student grades chart Excel template
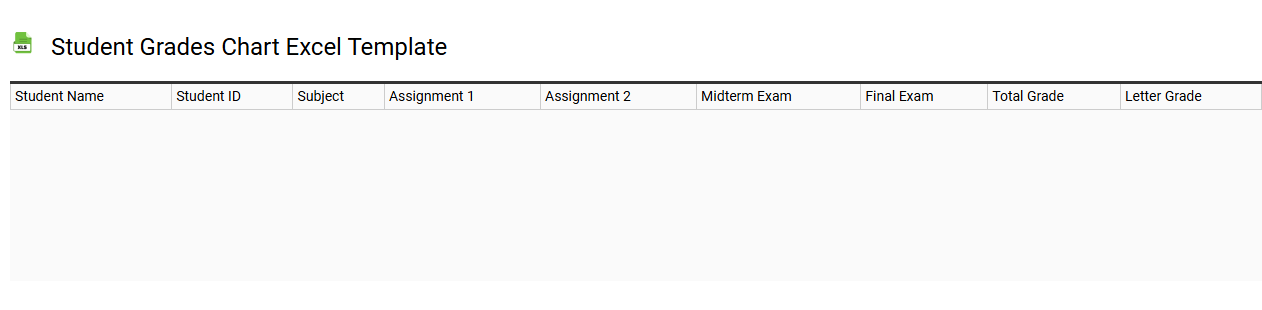
💾 Student grades chart Excel template template .xls
A Student Grades Chart Excel template serves as a versatile tool for educators and students by providing a structured way to track academic performance. This template typically includes columns for student names, subjects, individual assignment scores, and overall average grades, offering a clear overview of academic performance at a glance. You can easily input and analyze data, generating visual representations such as charts or graphs to identify trends and areas needing improvement. Beyond basic usage for grade tracking, advanced features may include automated calculations, conditional formatting for performance indicators, and data visualization for comprehensive performance insights.
Grade tracking Excel template for teachers
![]()
💾 Grade tracking Excel template for teachers template .xls
A Grade Tracking Excel template for teachers is a structured spreadsheet designed to help educators organize and manage student grades efficiently. This template typically includes columns for student names, assessment types, scores, and overall grades, enabling teachers to monitor academic performance easily. Advanced features may incorporate formulas for calculating averages, weighted grades, and identifying trends over time, streamlining the assessment process. If you seek a fundamental tool for tracking, consider exploring more advanced functionalities like pivot tables and graphical data representations to enhance insights into student performance.
High school grades chart Excel template
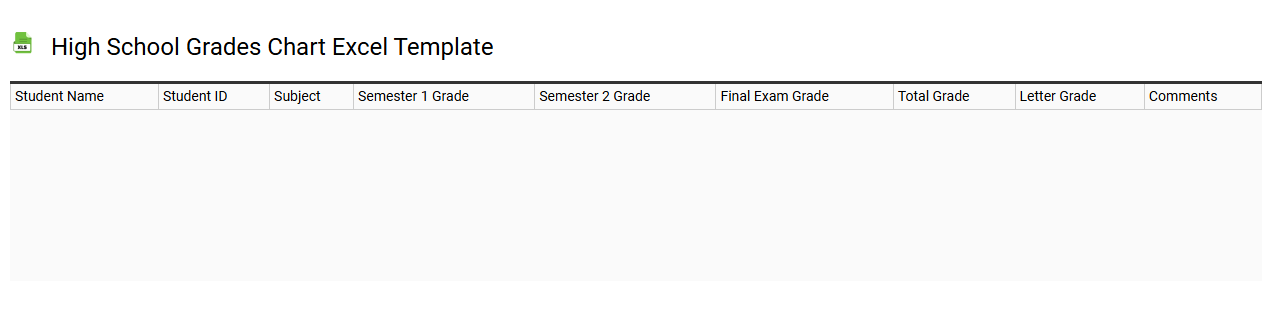
💾 High school grades chart Excel template template .xls
A high school grades chart Excel template is a structured spreadsheet designed to track student performance throughout their academic year. It typically includes columns for subjects, assignment scores, tests, and overall grades, allowing for easy monitoring of progress. Teachers or students can input data directly, instantly visualizing performance trends through color-coded grading systems or summary statistics. This versatile tool not only assists in tracking grades but can also be adapted for advanced analytics like predictive modeling or performance forecasting, catering to deeper educational insights.
Semester grades Excel template chart
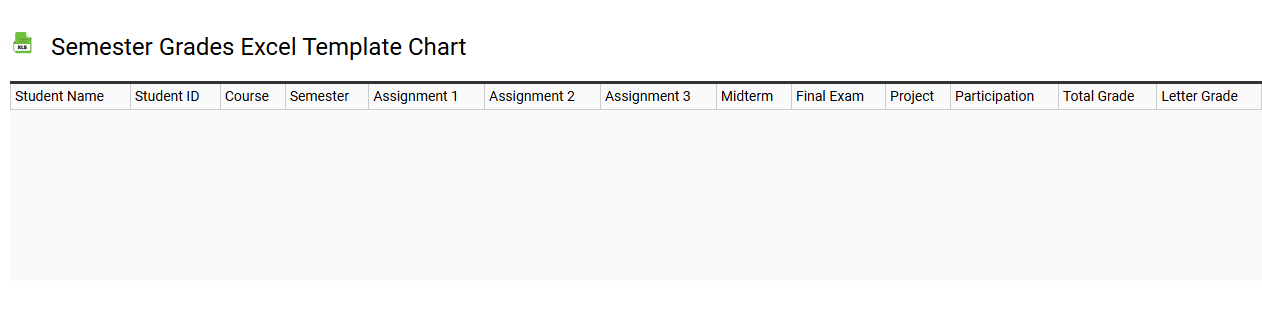
💾 Semester grades Excel template chart template .xls
A Semester Grades Excel template chart serves as a powerful tool for students and educators to track academic performance over a semester. This customizable spreadsheet allows you to input individual subject scores, calculate averages, and visualize progress through graphs. Each grade entry can be linked to specific assignments or exams, providing clarity on strengths and weaknesses in various subjects. While basic usage includes monitoring grades, more advanced options involve integrating formulas for weighted averages or forecasting final grades based on projected performance.
Simple student grades Excel template
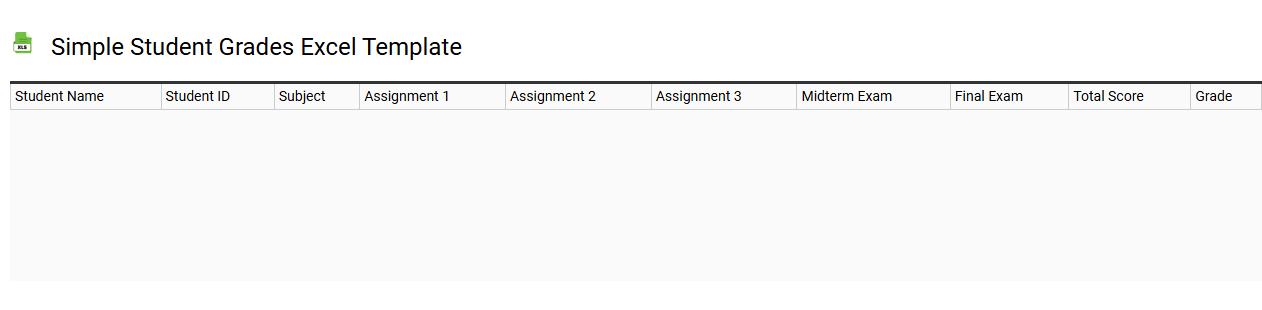
💾 Simple student grades Excel template template .xls
The Simple Student Grades Excel template is a user-friendly tool designed to help educators efficiently track student performance. It features columns for student names, subjects, assignment scores, and overall grades, allowing easy input and organization of data. With its intuitive layout, you can quickly calculate averages and identify areas where students may need additional support. This template can serve as a foundational tool for basic grade management and can be expanded with advanced functions like conditional formatting and visualization features to gain deeper insights into student progress.
College grade chart Excel template
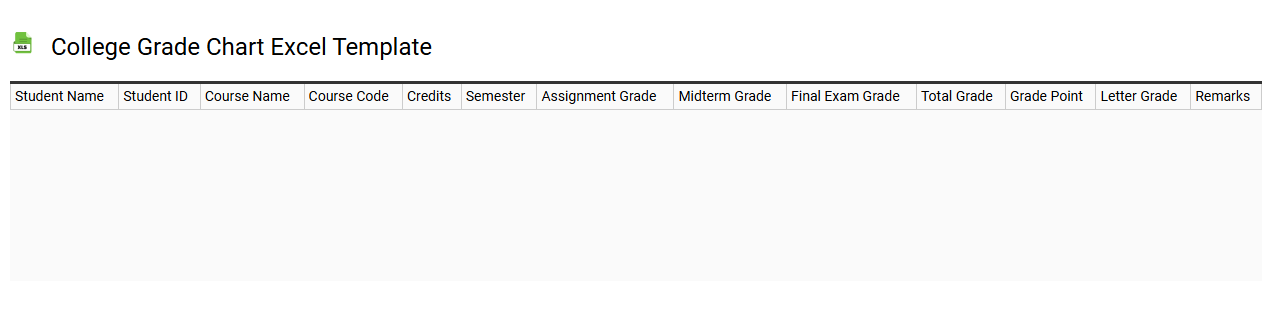
💾 College grade chart Excel template template .xls
A College grade chart Excel template is a structured spreadsheet designed to help you track students' academic performance throughout the semester. It typically includes columns for student names, course titles, assignment scores, midterm and final exam results, and overall grade calculations. This template allows for easy data entry and provides visual representations of grades, making it easy to identify trends and areas for improvement. Basic usage includes inputting scores for assignments and exams, while further potential needs could involve advanced features such as auto-calculating GPAs, conditional formatting for grade thresholds, and generating performance reports.
Subject wise grades chart Excel template
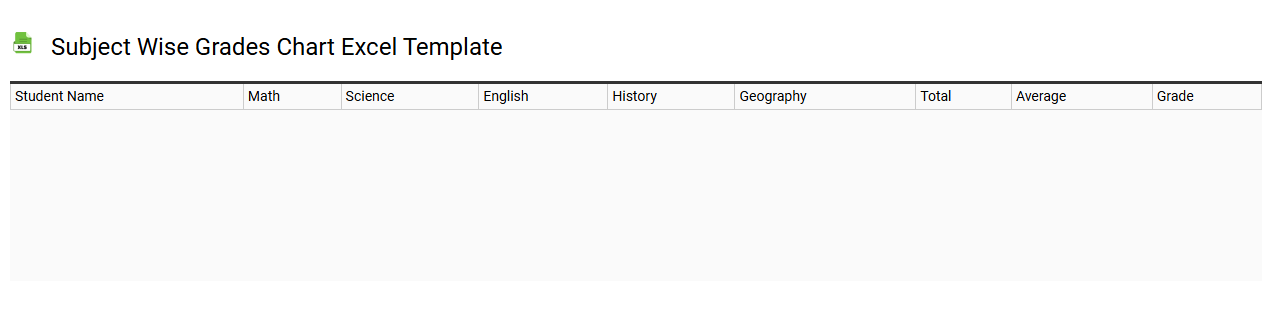
💾 Subject wise grades chart Excel template template .xls
A Subject-wise grades chart Excel template is a structured spreadsheet designed to track and analyze students' academic performance across various subjects. This template typically includes columns for student names, subject names, individual grades, and average scores, facilitating clear organization and quick assessment of progress. You can easily customize the template to include additional features, like graphical representations of data or conditional formatting for visual cues on performance levels. With such a tool, you can efficiently manage grade records for current evaluation and explore advanced functionalities such as trend analysis and predictive modeling for future academic requirements.
Weekly grades chart Excel template
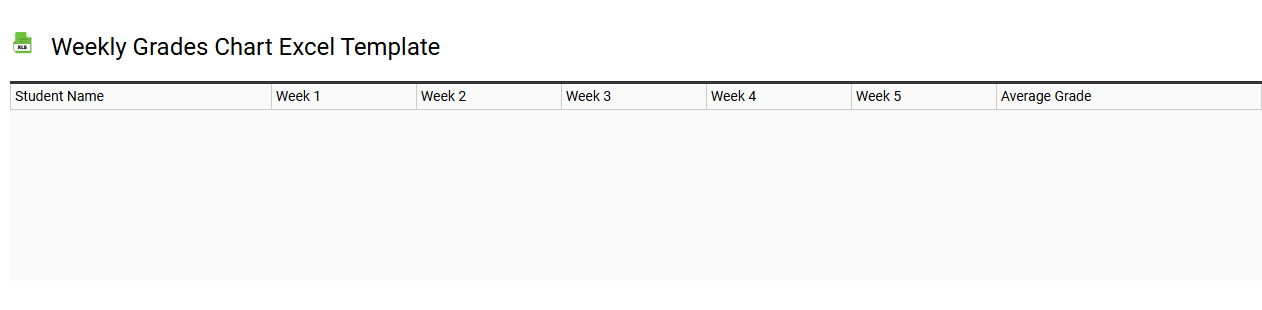
💾 Weekly grades chart Excel template template .xls
A Weekly Grades Chart Excel template is a structured spreadsheet designed to help you track and record student performance over the course of a week. It typically includes columns for various subjects or assignments, allowing for easy input of grades on a daily basis. Color-coded cells might be used to visualize performance trends, providing immediate feedback and insights into areas needing improvement. You can easily customize the template to incorporate additional metrics or grading scales as your needs evolve, including advanced features like conditional formatting and data analysis tools.
Final exam grades Excel template chart
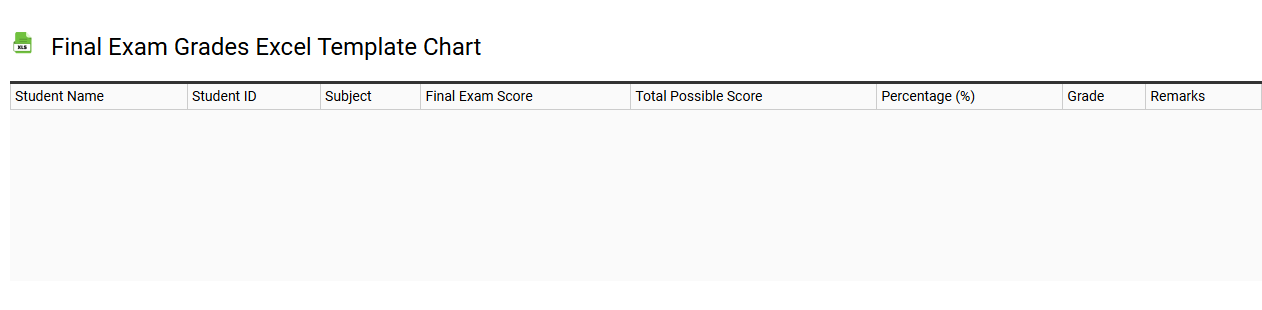
💾 Final exam grades Excel template chart template .xls
A Final Exam Grades Excel template chart is a pre-designed spreadsheet that allows educators and students to organize and analyze final exam scores efficiently. This template typically includes columns for student names, exam scores, weighted averages, and overall grades, providing a clear visual representation of performance. Color-coded grading scales often enhance readability, making it easy to identify top performers and those who may need additional support. Such a tool simplifies the tracking of academic progress and can serve as a foundation for deeper statistical analysis or customized grade calculations tailored to your specific assessment needs.
Editable grade chart Excel template
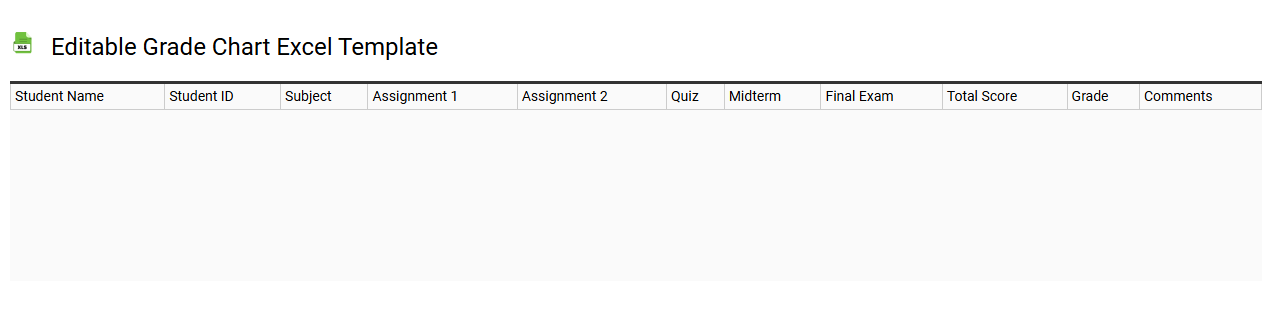
💾 Editable grade chart Excel template template .xls
An Editable Grade Chart Excel template is a customizable tool that allows educators or students to input, organize, and analyze academic performance data easily. This template typically features sections for student names, subjects, assignment scores, and final grades, enabling straightforward tracking of progress over time. Built-in formulas can automatically calculate averages and grade distributions, providing instant feedback on student performance. You can tailor the template to suit your specific grading criteria, and expand its functionality by incorporating advanced features like conditional formatting or pivot tables for comprehensive data analysis.