Explore a variety of free XLS templates specifically designed for monthly sales reporting. These templates feature user-friendly layouts that allow you to input and organize your sales data effortlessly. Each template includes built-in formulas and charts, making it easy to visualize trends and track performance over time.
Monthly sales report Excel template free download
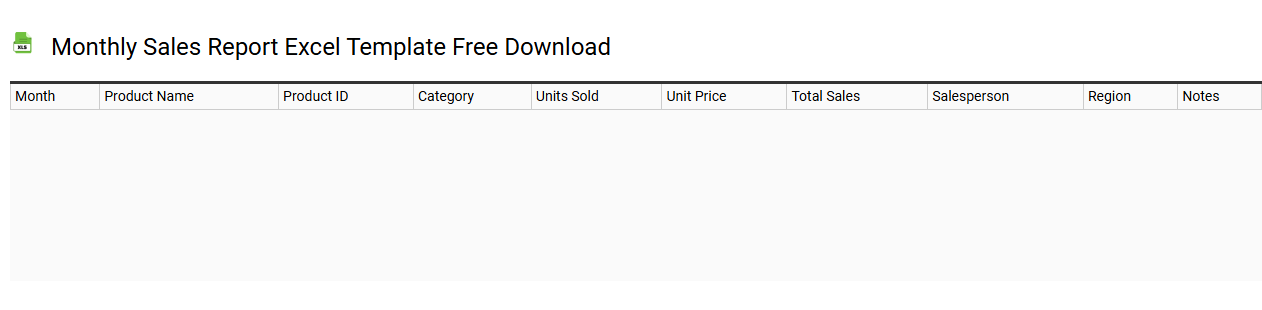
💾 Monthly sales report Excel template free download template .xls
A monthly sales report Excel template is a structured file designed to help businesses track their sales performance over a month. This template typically includes sections for recording the date of each sale, product details, quantities sold, sales revenue, and any discounts applied. You can easily customize the template to suit your specific needs, such as adding charts for visual representation or including formulas for automatic calculations. Your sales data can serve as a foundation for more advanced analysis, such as forecasting trends and evaluating customer behavior using tools like pivot tables and advanced statistical functions.
Monthly sales report Excel template with charts
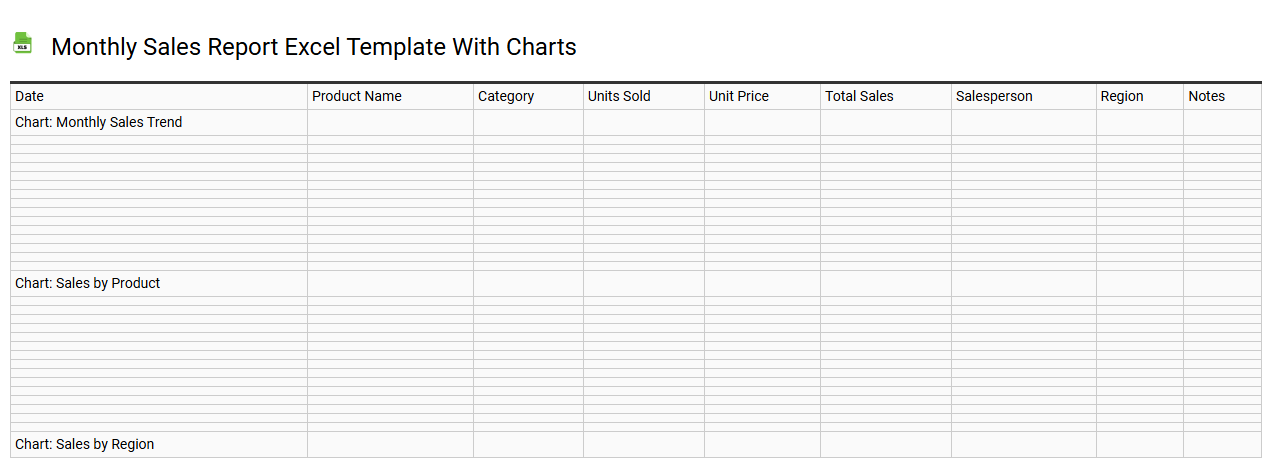
💾 Monthly sales report Excel template with charts template .xls
A Monthly Sales Report Excel template with charts visually represents sales performance over a specific month, integrating essential data such as total sales, product breakdowns, and sales trends. Clear and concise charts, including bar graphs and pie charts, help identify top-selling products and overall sales patterns, making it easier to analyze performance at a glance. Each chart can be customized to showcase specific metrics, allowing for better insights into customer behavior and sales strategies. This template not only serves basic reporting needs but can also be adapted for advanced analytics, such as forecasting and sales conversion optimization.
Simple monthly sales report Excel template
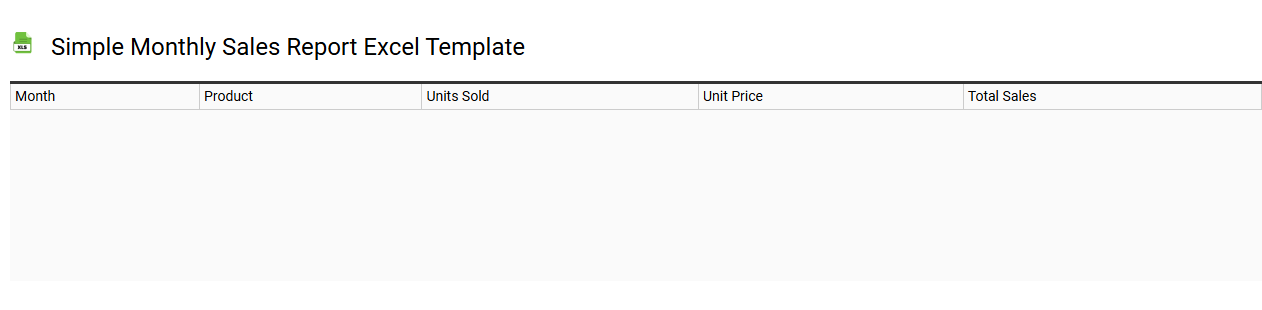
💾 Simple monthly sales report Excel template template .xls
A Simple Monthly Sales Report Excel template is a structured spreadsheet designed to help businesses track and analyze their sales performance over a month. It typically includes sections for recording sales figures, customer details, product categories, and sales representatives involved. You can visualize your data through charts and graphs, making it easier to identify trends and areas requiring attention. This template supports basic usage, while advanced features like pivot tables and forecasting tools can enhance your sales analysis further.
Monthly sales report Excel template for small business
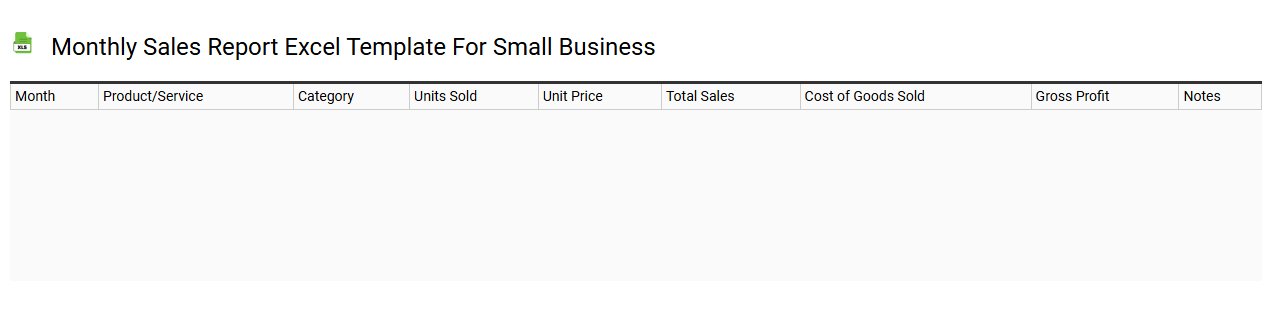
💾 Monthly sales report Excel template for small business template .xls
A Monthly Sales Report Excel template for small businesses serves as a structured tool to track and analyze sales performance over a designated period. This template typically includes sections for date, product or service details, quantity sold, unit prices, and total sales revenue. You can customize the template to accommodate specific goals, such as monitoring sales trends, evaluating employee performance, or identifying best-selling products. The basic usage provides an overview of your sales data, while advanced options may incorporate analytics such as forecasting, conversion rates, and customer segmentation for deeper insights.
Editable monthly sales report Excel template
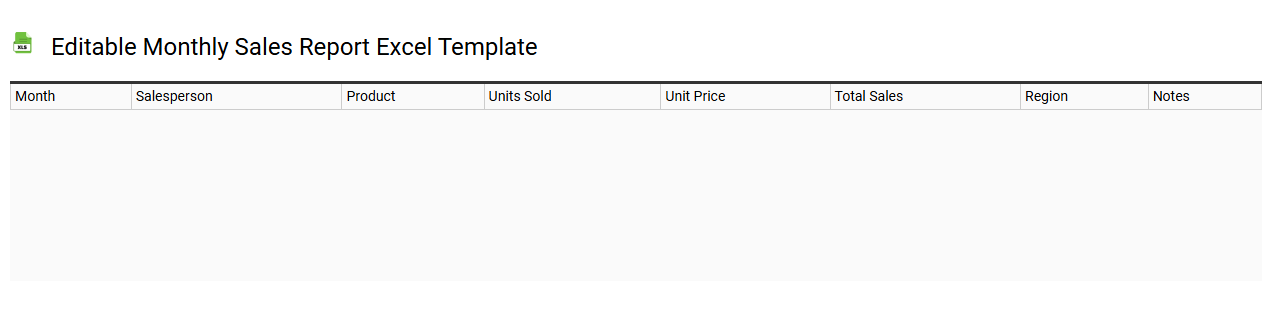
💾 Editable monthly sales report Excel template template .xls
An editable monthly sales report Excel template is a customizable spreadsheet designed to help businesses track and analyze their sales performance on a monthly basis. This template typically includes sections for inputting sales figures, calculating totals, and visualizing data through charts and graphs. You can easily modify the template to suit your specific needs, adding or removing categories such as product lines or sales channels. For more advanced needs, consider incorporating features like pivot tables or advanced data analysis tools to gain deeper insights into your sales trends.
Monthly sales report Excel template with dashboard
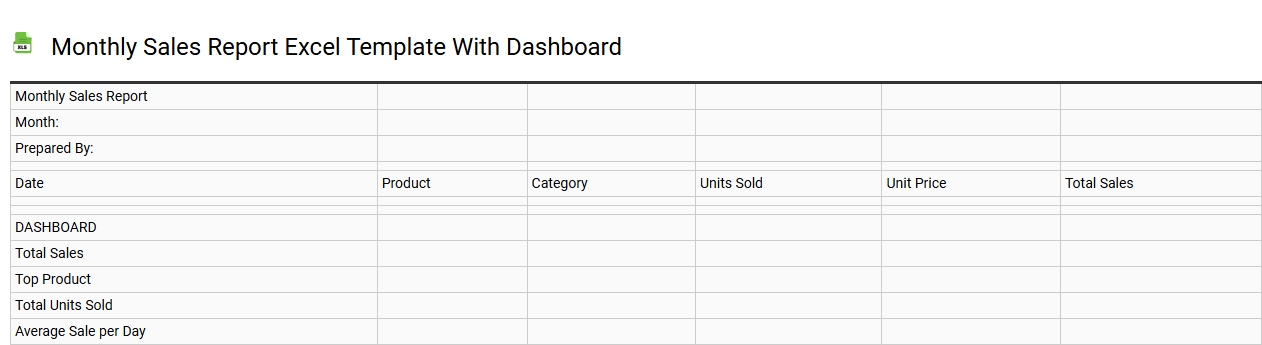
💾 Monthly sales report Excel template with dashboard template .xls
A Monthly Sales Report Excel template with a dashboard is a powerful tool for tracking and analyzing sales performance over a specific month. This template typically features visually appealing graphical representations, such as charts and graphs, which summarize key metrics like total sales, revenue by product line, and sales growth percentage. You can easily input your sales data, and the dashboard will dynamically update to provide insights into trends, comparisons, and performance against targets. This setup is beneficial for decision-making, allowing you to identify areas for improvement or expansion, and can also be customized to include advanced analytics like predictive modeling or real-time data integration.
Monthly sales report Excel template for products
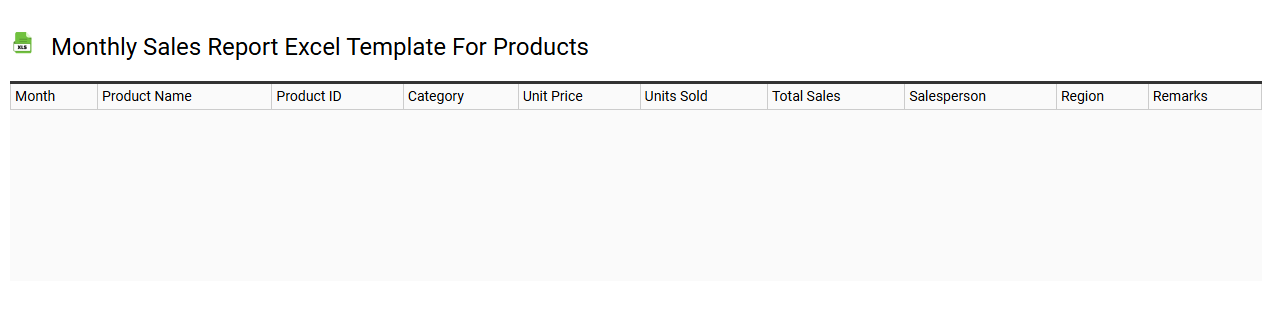
💾 Monthly sales report Excel template for products template .xls
A Monthly Sales Report Excel template for products is a structured document designed to track and analyze sales data over a specific month. This template typically includes sections for product names, quantities sold, revenue generated, and any discounts applied. Visual aids like charts and graphs can enhance the data representation, making it easier for you to identify trends and make informed decisions. Basic usage of this template can help streamline sales tracking, while further potential needs might involve advanced analytics features like pivot tables, forecasting, or integrating with financial modeling tools.
Monthly sales report Excel template automatic calculation
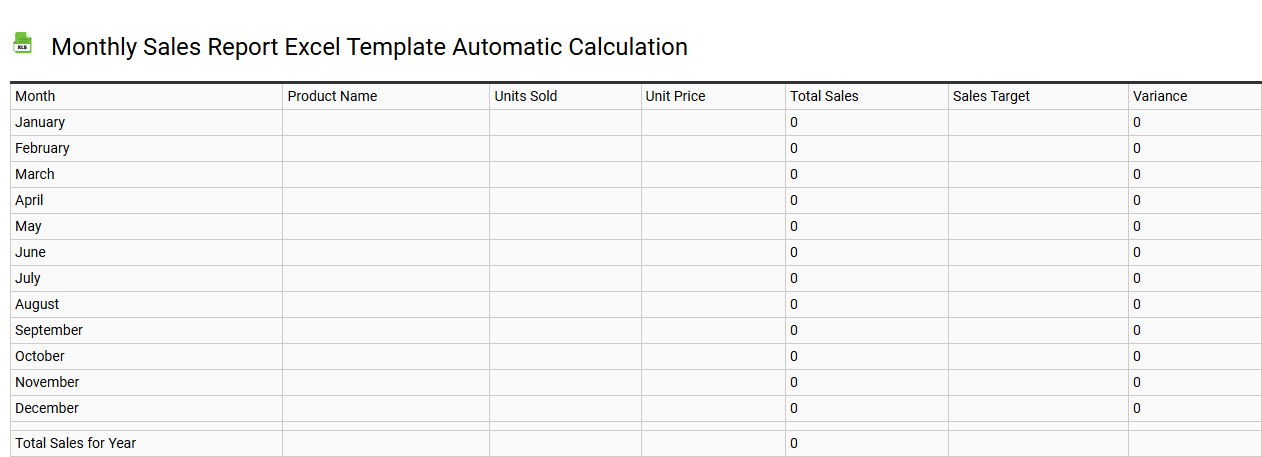
💾 Monthly sales report Excel template automatic calculation template .xls
A Monthly Sales Report Excel template with automatic calculation streamlines the process of tracking revenues, expenses, and profits. It typically features pre-set formulas that update totals automatically as you input sales data, eliminating manual calculations and reducing errors. Visual elements like charts and graphs enhance data comprehension, providing a clear overview of sales trends and performance metrics. This efficient tool can support basic sales tracking while offering the potential to expand into advanced analytics, such as forecasting and profitability analysis through advanced functions and pivot tables.
Detailed monthly sales report Excel template
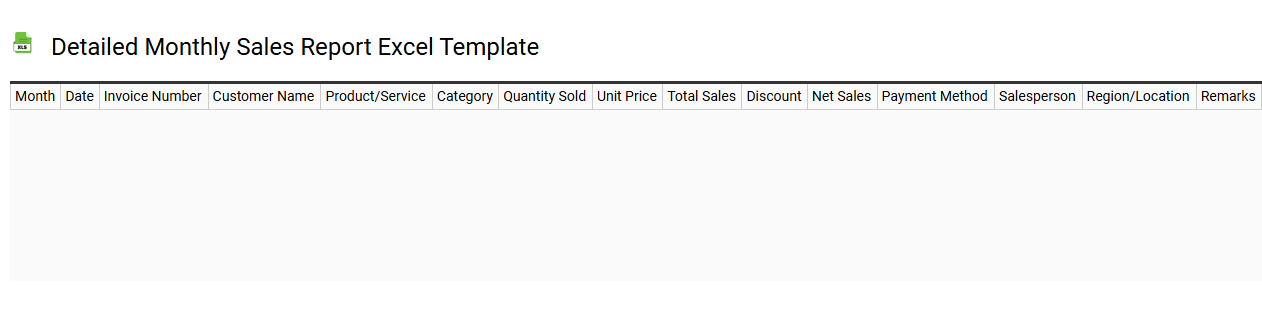
💾 Detailed monthly sales report Excel template template .xls
A detailed monthly sales report Excel template is a structured spreadsheet designed to track and analyze sales performance over a month. It typically includes sections for different product categories, sales volume, revenue figures, and a comparison with previous months or goals. You can also visualize this data through graphs or charts integrated into the template, making it easier to identify trends and areas needing attention. Such templates cater to various industries and can further adapt to include advanced metrics like customer acquisition cost or lifetime value analysis for deeper insights into sales performance.
Printable monthly sales report Excel template
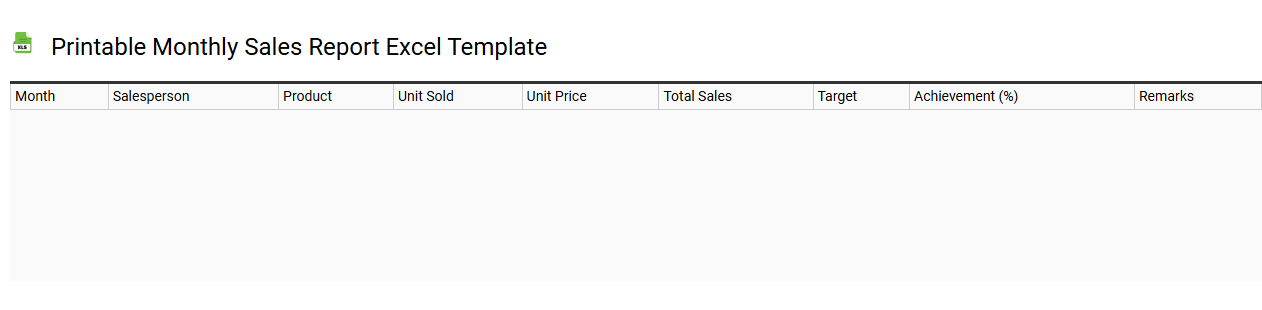
💾 Printable monthly sales report Excel template template .xls
A printable monthly sales report Excel template is a pre-designed spreadsheet that helps businesses track and analyze their sales performance over a month. This template typically includes sections for dates, product names, quantities sold, sales revenue, and notes, offering a clear overview of sales metrics. Features like formulas for calculating totals and visual charts can enhance data interpretation and assist in identifying trends. Utilizing this template can streamline reporting processes, while further customization and integration with advanced analytics tools may be necessary for deeper insights.