Explore a diverse collection of free Excel templates specifically designed for KPI analysis. Each template features customizable dashboards, allowing you to track key performance indicators with ease and precision. Clear visual representations, including charts and graphs, help you analyze your data efficiently, enabling better strategic decision-making for your business.
KPI analysis dashboard Excel template
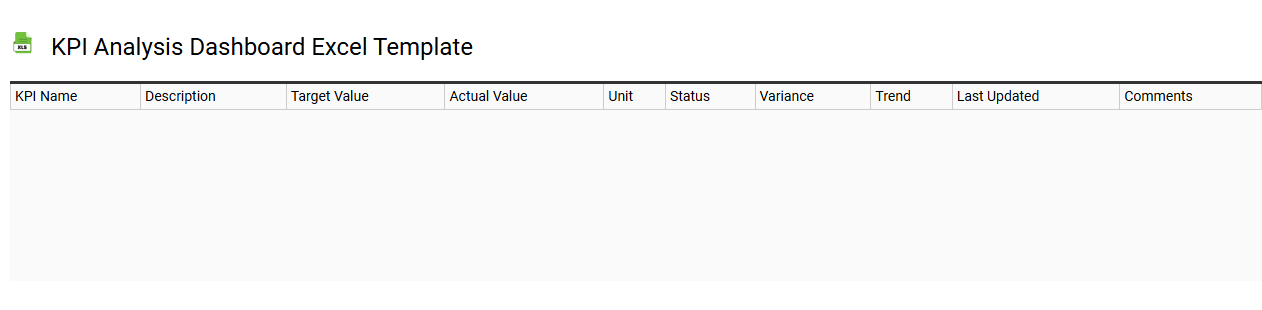
💾 KPI analysis dashboard Excel template template .xls
A KPI analysis dashboard Excel template serves as a visual tool to track and measure key performance indicators essential for business success. This template typically features charts, graphs, and tables that provide insights into various metrics, allowing for quick assessments of performance against set goals. Users can customize the dashboard to reflect specific business objectives, making it easier to identify trends and areas for improvement. Utilizing this template can help you streamline reporting processes and make data-driven decisions, paving the way for more sophisticated analytics like predictive modeling or data visualization techniques.
Sales KPI analysis Excel template
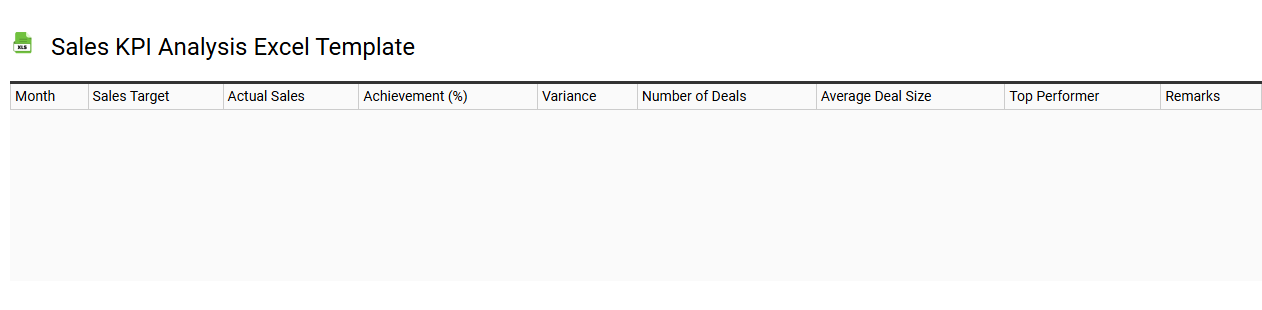
💾 Sales KPI analysis Excel template template .xls
Sales KPI analysis Excel templates are pre-structured spreadsheets designed to track, evaluate, and visualize key performance indicators related to sales metrics. These templates include sections for data entry, charts for visual representation, and formulas for automatic calculations, allowing you to easily assess your sales performance. You can monitor metrics like total sales revenue, conversion rates, and average deal size, enabling informed decision-making for business growth. Understanding these fundamentals can significantly enhance your sales strategy, with potential expansions into complex data analytics or predictive modeling for long-term forecasting.
HR KPI tracking Excel template
![]()
💾 HR KPI tracking Excel template template .xls
An HR KPI tracking Excel template is a pre-designed spreadsheet designed to help human resources professionals monitor and evaluate key performance indicators related to workforce management. This template typically includes various metrics such as employee turnover rate, time to hire, training effectiveness, and employee satisfaction scores. You can easily customize it to fit your organization's specific needs, enabling you to visualize data trends and make informed decisions regarding HR strategies. Beyond basic tracking, this template can also be adapted for more advanced analytics like predictive modeling and workforce planning.
Marketing KPI analysis Excel template
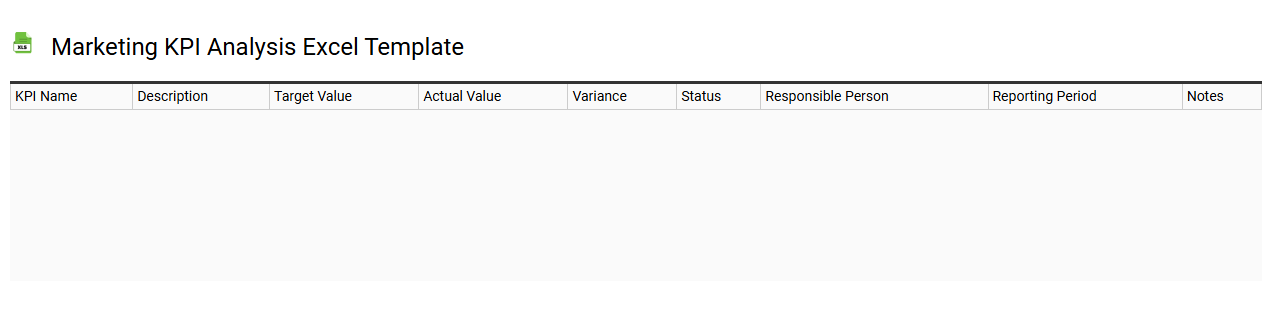
💾 Marketing KPI analysis Excel template template .xls
A Marketing KPI analysis Excel template is a structured spreadsheet designed to track and measure key performance indicators relevant to marketing campaigns. This tool allows you to input data such as conversion rates, customer acquisition costs, and return on investment, visually presenting the information through charts and graphs for easier interpretation. By organizing data in a systematic manner, the template facilitates performance evaluation, helping you identify trends and areas for improvement. Understanding basic usage is essential, while advanced features might include predictive analytics and automated reporting functionalities.
Financial KPI analysis Excel template
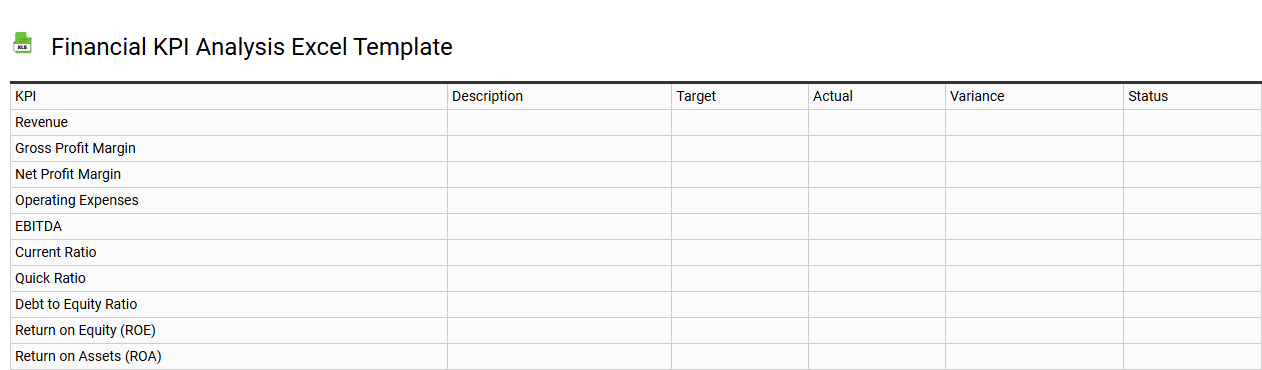
💾 Financial KPI analysis Excel template template .xls
A Financial KPI analysis Excel template is a structured tool designed to help businesses track, measure, and analyze key performance indicators related to their financial performance. This template typically includes various metrics such as revenue growth, profit margins, return on investment (ROI), and operating expenses, allowing for quick visualization of financial health. You can easily input your financial data, generate charts, and compare performance against historical data or industry benchmarks. Utilizing such a template can enhance your ability to make informed decisions, identify trends, and forecast future financial needs, paving the way for sophisticated analyses like break-even analysis or financial modeling.
Project KPI analysis Excel template
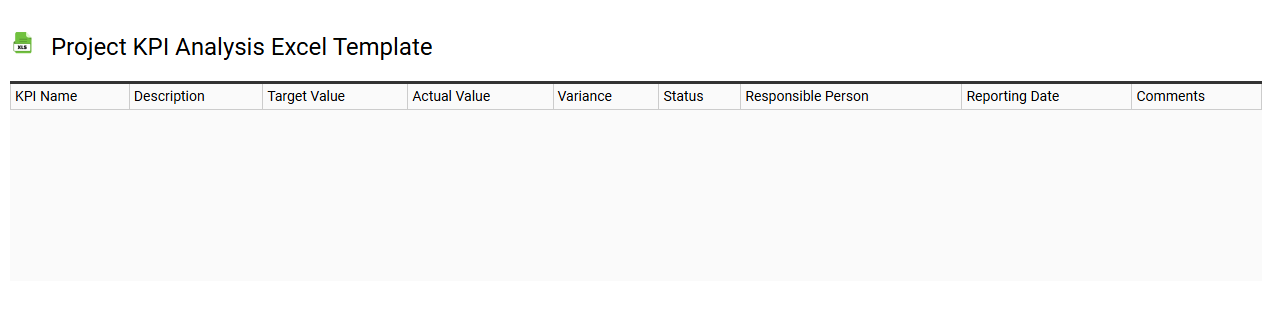
💾 Project KPI analysis Excel template template .xls
A Project KPI analysis Excel template is a structured tool designed to help project managers and teams track, measure, and visualize Key Performance Indicators (KPIs) related to project performance. This template typically includes predefined fields for inputting various metrics, such as budget adherence, timelines, resource allocation, and quality measures. Users can easily update data points to reflect current project status, enabling real-time insights into performance trends and areas that require attention. For those looking to further enhance project management capabilities, advanced features like pivot tables, data visualization charts, and integration with project management software can provide deeper analytics and forecasting.
Monthly KPI analysis Excel template
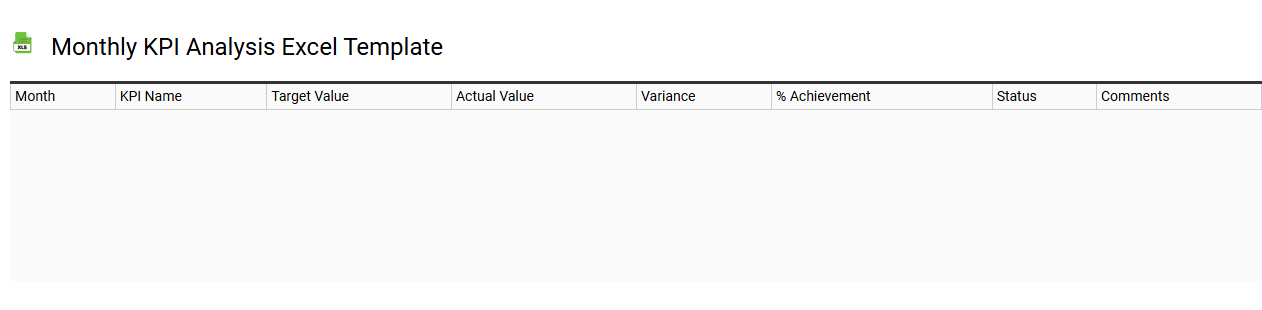
💾 Monthly KPI analysis Excel template template .xls
A Monthly KPI Analysis Excel template is a structured spreadsheet designed to help businesses track, analyze, and visualize key performance indicators (KPIs) over a monthly timeframe. This template typically includes sections for inputting data related to sales, customer engagement, financial performance, or operational efficiency, allowing users to easily compare current metrics against targets or historical data. Visualization tools like charts and graphs are often integrated, enabling quick insights into trends and performance fluctuations. Such templates serve as foundational tools for routine performance assessments while offering potential for deeper analytical explorations using advanced functions like pivot tables and data modeling techniques.
Business KPI analysis Excel template

💾 Business KPI analysis Excel template template .xls
A Business KPI analysis Excel template is a pre-designed spreadsheet that helps organizations track and analyze key performance indicators (KPIs). This template typically includes various metrics such as sales growth, customer acquisition costs, and employee productivity, allowing users to visualize their business performance in a straightforward manner. You can easily customize the template to add specific KPIs relevant to your business objectives, enhancing its applicability and efficiency. Beyond basic tracking, the template may be tailored for advanced analytics, enabling insights through predictive modeling and scenario analysis.
Team performance KPI analysis Excel template
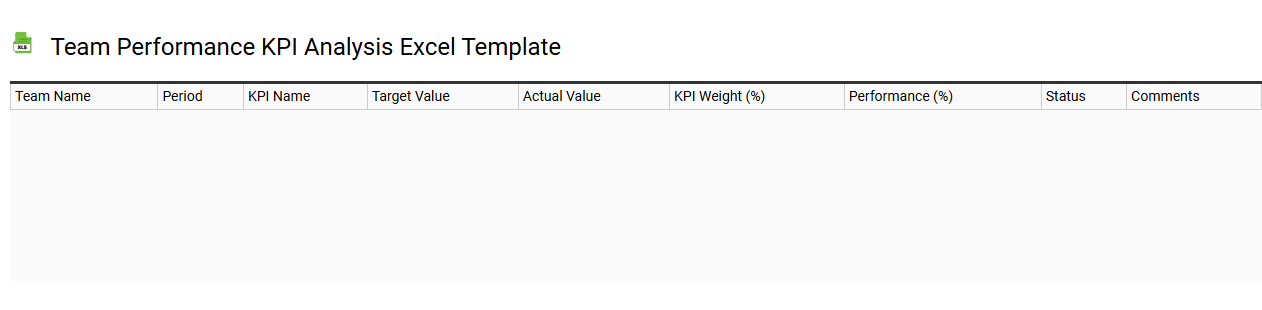
💾 Team performance KPI analysis Excel template template .xls
A Team Performance KPI Analysis Excel template is a structured tool designed to track and evaluate key performance indicators (KPIs) relevant to team dynamics and productivity. This template allows you to input metrics such as individual contributions, project completion rates, and collaboration effectiveness, making it easier to visualize overall team performance through charts and graphs. With organized data, stakeholders can identify strengths and weaknesses, facilitating informed decision-making for improvement strategies. The basic usage of this template can lead to more advanced needs, such as integrated dashboards or predictive analytics for future performance forecasting.
Department KPI analysis Excel template
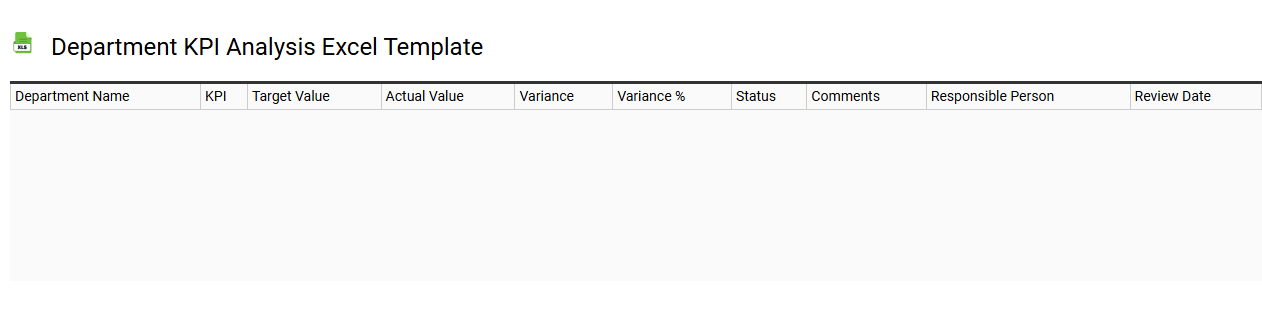
💾 Department KPI analysis Excel template template .xls
A Department KPI analysis Excel template is a structured tool designed to help organizations track, measure, and analyze key performance indicators specific to various departments. This template typically includes sections for entering data related to targets, actual performance metrics, and variances, allowing for easy comparison and reporting. By visualizing trends through charts and graphs, stakeholders can quickly assess departmental performance and identify areas for improvement. Your organization can utilize this template for basic performance tracking, while advanced users may explore automated dashboards, predictive analytics, and data integration with business intelligence tools.