Explore an array of free XLS templates designed for pipeline analysis. These templates streamline data organization, allowing you to visualize your pipeline stages effectively. With customizable fields, you can track metrics such as project status, lead conversion rates, and revenue projections seamlessly, enhancing your decision-making process.
Sales pipeline analysis Excel template

💾 Sales pipeline analysis Excel template template .xls
A Sales Pipeline Analysis Excel template is a structured tool designed to track and manage potential sales opportunities throughout the sales process. It typically includes various stages, such as lead generation, qualification, proposal, and closing, allowing you to visualize where each prospect stands. Customizable fields for tracking important metrics like deal size, expected close date, and sales representative enable effective monitoring of performance. This template not only aids in current sales management but can also be adapted for more advanced analytics like forecasting, conversion rates, and sales cycle optimization.
Project pipeline analysis Excel template
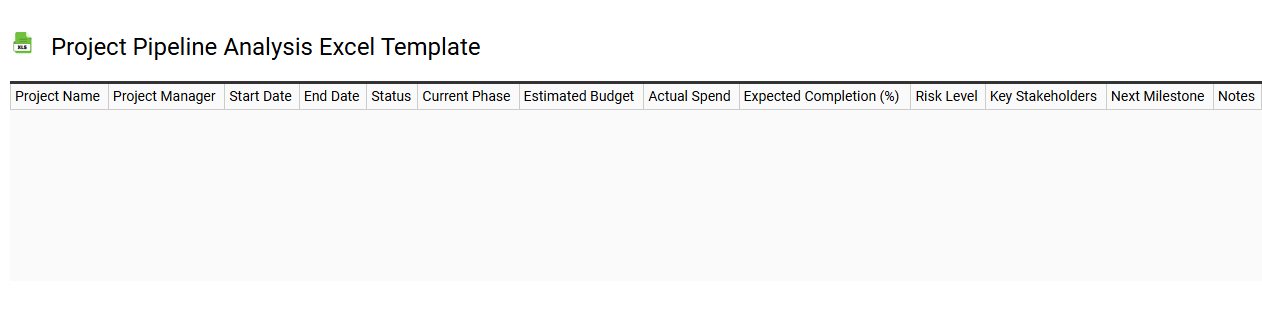
💾 Project pipeline analysis Excel template template .xls
A Project Pipeline Analysis Excel template is a structured spreadsheet designed to manage and analyze ongoing or prospective projects within an organization. This template typically includes columns for project names, statuses, timelines, budgets, resources, and potential risks, providing a comprehensive overview of all projects in the pipeline. You can customize it to track key performance indicators (KPIs) and ensure you stay on top of deadlines and deliverables. As your project management needs evolve, advanced functionalities such as predictive analytics or integration with project management software may enhance your planning and resource allocation.
Real estate pipeline analysis Excel template
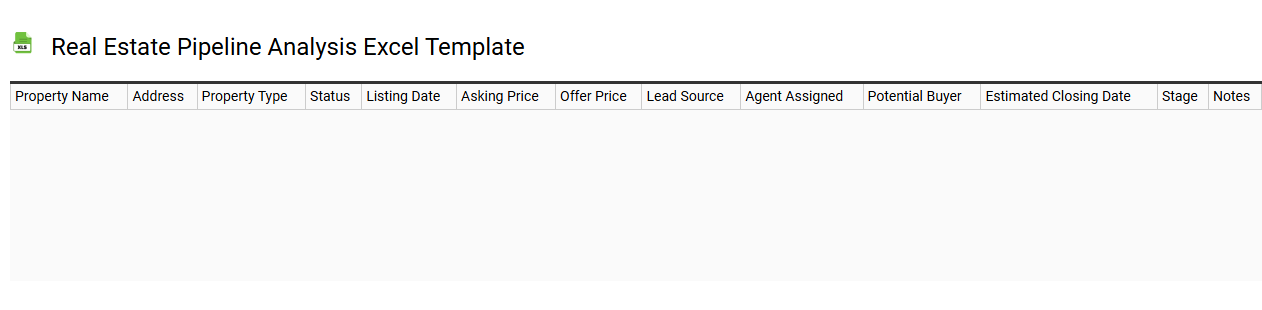
💾 Real estate pipeline analysis Excel template template .xls
A real estate pipeline analysis Excel template is a structured tool designed to track and evaluate various property investments within a real estate portfolio. This template typically includes categories for property address, acquisition costs, expected rental income, occupancy rates, and sales status. Users can monitor cash flows, calculate returns on investment, and forecast potential gains or losses over time. Mastering this template can enhance your understanding of property performance, opening avenues for sophisticated financial modeling and risk assessments in real estate ventures.
Deal pipeline analysis Excel template
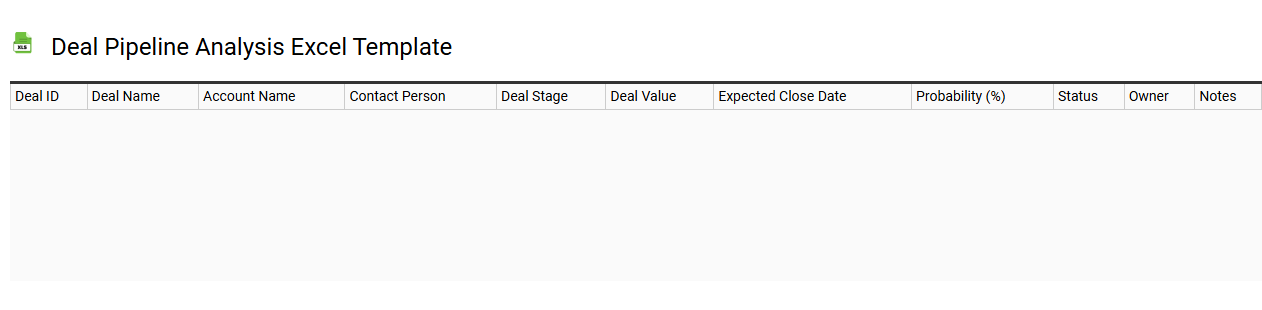
💾 Deal pipeline analysis Excel template template .xls
A Deal pipeline analysis Excel template provides a structured way to manage and evaluate your sales opportunities. It typically includes columns for important details such as deal value, stage in the sales process, expected close date, and probability of closing. This template allows you to visualize your sales efforts, track progress, and make data-driven decisions to optimize your sales strategy. For basic usage, you can input key metrics, while more advanced iterations might involve complex formulas, pivot tables, and forecasting analysis for deeper insights into deal performance.
Recruitment pipeline analysis Excel template

💾 Recruitment pipeline analysis Excel template template .xls
A Recruitment Pipeline Analysis Excel template helps organizations track potential candidates throughout the recruitment process. This tool organizes data such as candidate names, their application dates, interview stages, and feedback scores. It allows for visualizing bottlenecks and optimizing efficiency in hiring by providing insights into time taken at each stage. You can utilize this template to improve your recruitment strategy and meet future hiring demands, including advanced analytics and integration with applicant tracking systems.
Marketing pipeline analysis Excel template
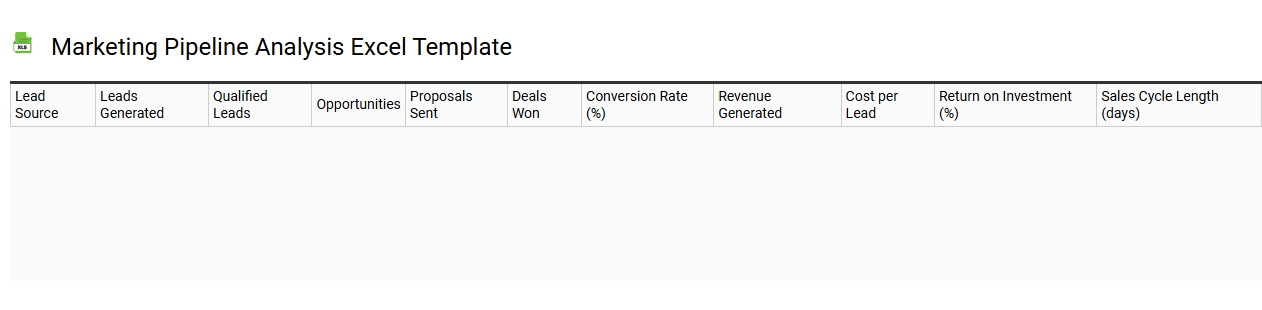
💾 Marketing pipeline analysis Excel template template .xls
A Marketing pipeline analysis Excel template serves as a strategic tool designed to visualize and assess the stages of your marketing efforts. It typically includes sections for lead generation, conversion rates, and overall campaign performance metrics, which can help you identify bottlenecks in the sales process. With clearly defined columns for each phase, you can easily track revenue projections and analyze marketing spend against returns. Such a template empowers you to make data-driven decisions regarding campaign adjustments or resource allocations, and it lays the groundwork for advanced analytics like predictive modeling or customer segmentation.
Opportunity pipeline analysis Excel template
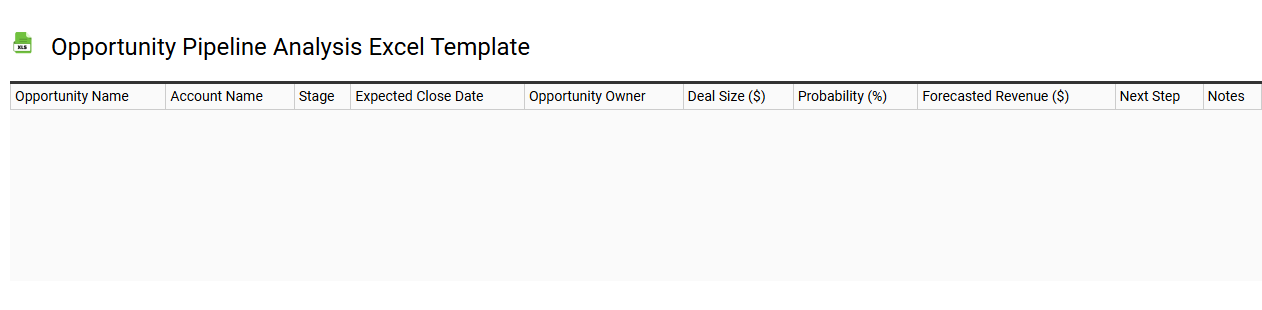
💾 Opportunity pipeline analysis Excel template template .xls
An Opportunity Pipeline Analysis Excel template serves as a structured tool for tracking and evaluating sales opportunities throughout their lifecycle. This template typically includes columns for opportunity names, stages, potential revenue, probability of closing, and expected close dates, allowing users to systematically organize and prioritize their deals. Detailed visualizations like charts and graphs can represent the data, providing insights into trends and bottlenecks in the sales process. This template not only fulfills basic analysis needs for understanding current opportunities but also offers the potential for more advanced functionalities, such as integrating predictive analytics or automating sales forecasting.
Investment pipeline analysis Excel template
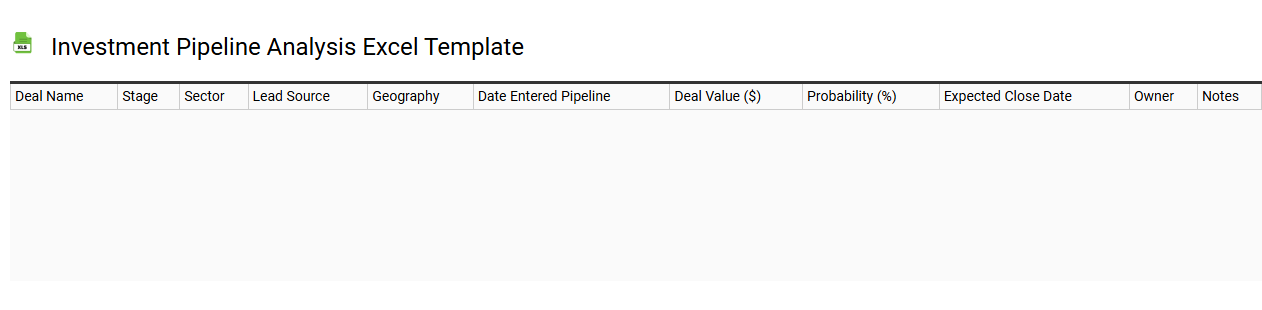
💾 Investment pipeline analysis Excel template template .xls
An Investment Pipeline Analysis Excel template is a structured tool that helps users evaluate and track potential investment opportunities. This template typically includes various sheets or sections for listing investments, assessing their potential returns, risks, and phases of development. Key metrics like internal rate of return (IRR), net present value (NPV), and investment timelines are often highlighted to facilitate comprehensive analysis. You can leverage this template for basic tracking needs, while more advanced users might integrate it with financial modeling software or employ valuation methodologies like Monte Carlo simulations for deeper insights.
Customer pipeline analysis Excel template
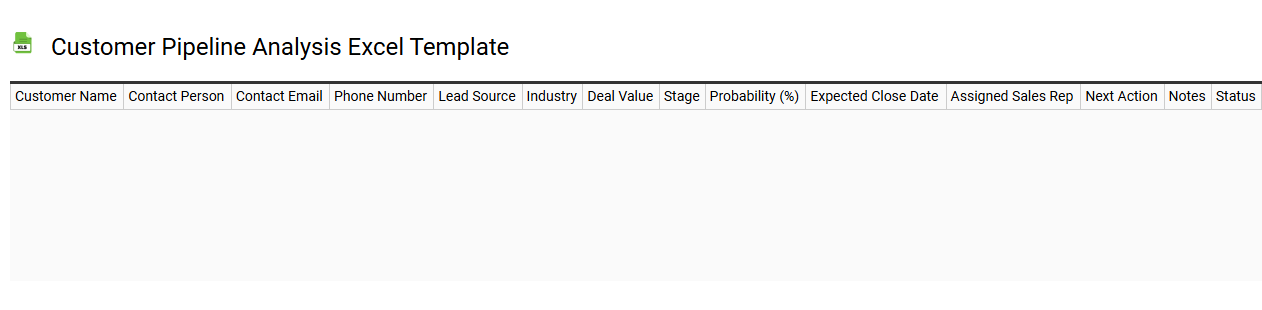
💾 Customer pipeline analysis Excel template template .xls
A Customer Pipeline Analysis Excel template is a structured tool designed to help businesses track and analyze their sales prospects throughout various stages of the sales funnel. It typically includes columns for prospect names, contact details, stages of engagement, anticipated close dates, and potential revenue associated with each lead. This template allows you to easily visualize your sales process, identify bottlenecks, and prioritize follow-ups to improve conversion rates. For basic usage, you can manage current leads effectively, while more advanced features might include predictive analytics and integration with CRM systems to enhance forecasting accuracy.
Construction pipeline analysis Excel template
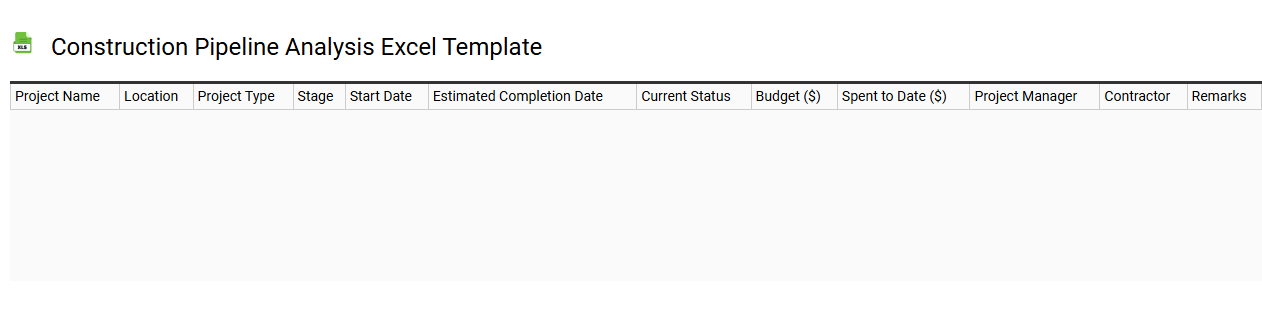
💾 Construction pipeline analysis Excel template template .xls
A Construction Pipeline Analysis Excel template serves as a powerful tool for project management within the construction industry. It allows you to track and manage various stages of construction projects, providing insights into timelines, budgets, and resource allocation. This structured format enables you to visualize the flow of ongoing and upcoming projects, helping to identify potential bottlenecks or delays. You can enhance your operational efficiency by utilizing this template for basic project tracking or expand its capabilities to include advanced analytics and forecasting methods.