Explore an array of free XLS templates designed for trend analysis in Excel, ideal for both professionals and students. These templates come equipped with customizable charts and pre-defined formulas, enabling seamless tracking of data over time while enhancing your analytical skills. Utilize features like color-coded indicators and dynamic graphs to create visually appealing and informative presentations of your data trends.
Monthly trend analysis Excel template
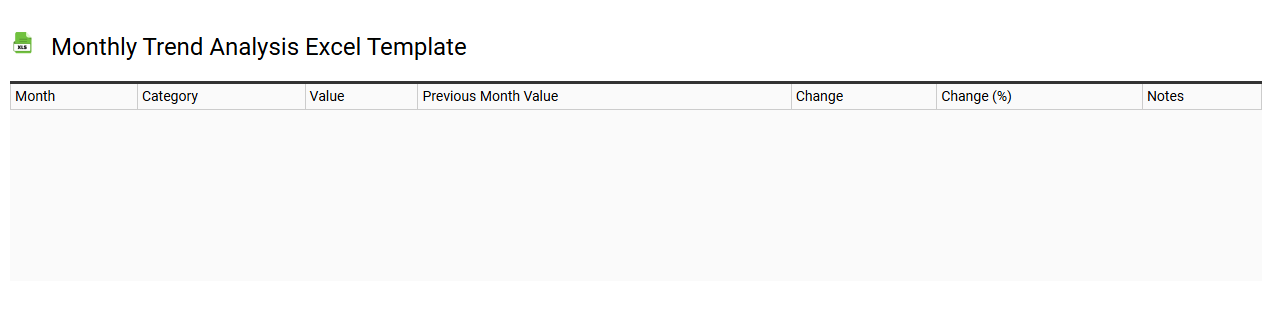
💾 Monthly trend analysis Excel template template .xls
A Monthly Trend Analysis Excel template is a pre-designed spreadsheet used to track and analyze data trends over a monthly period. This template typically includes graphs and charts that visualize key metrics, making it easier to identify patterns and anomalies in the data. You can input data such as sales figures, expenses, or customer engagement statistics to assess performance and derive actionable insights. Basic usage includes recording monthly data to monitor growth, while further potential needs may encompass advanced analytical features such as predictive modeling and regression analysis.
Yearly trend analysis Excel template
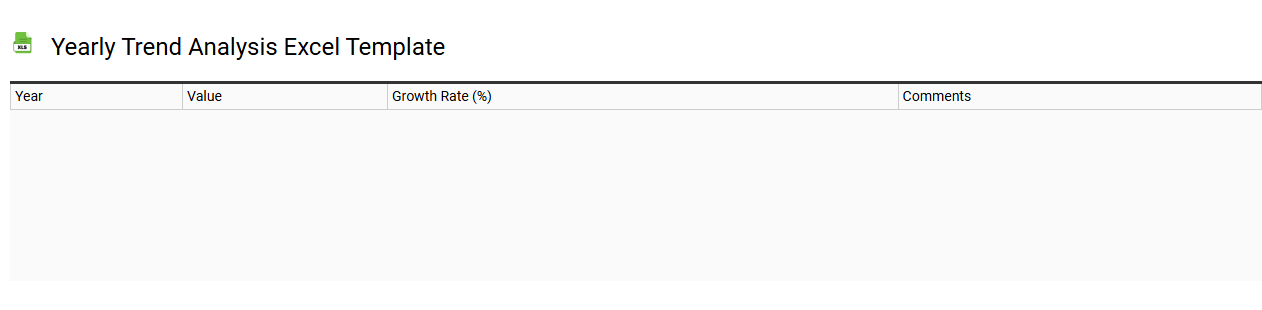
💾 Yearly trend analysis Excel template template .xls
A Yearly trend analysis Excel template is a powerful tool designed to help you visualize and interpret data over the course of a year. It typically features graphs and charts that illustrate metrics like sales, expenses, or customer engagement, allowing for easy comparison across different time periods. This template often includes built-in formulas for calculating growth rates and averages, ensuring accuracy and efficiency in your analysis. By utilizing this template, you can identify patterns, make informed decisions, and uncover areas for improvement, paving the way for more advanced analyses such as predictive modeling or scenario planning.
Financial trend analysis Excel template

💾 Financial trend analysis Excel template template .xls
A Financial Trend Analysis Excel template serves as a powerful tool for assessing a company's financial performance over time. It typically includes key financial metrics like revenue, expenses, profit margins, and cash flows, allowing users to visualize and track changes through graphs and charts. By organizing data systematically, this template aids in identifying patterns, anomalies, and forecasting future performance, enhancing decision-making capabilities. You can utilize this template for basic financial tracking, while more advanced needs may involve integrating predictive analytics and machine learning techniques for deeper insights.
Stock price trend analysis Excel template
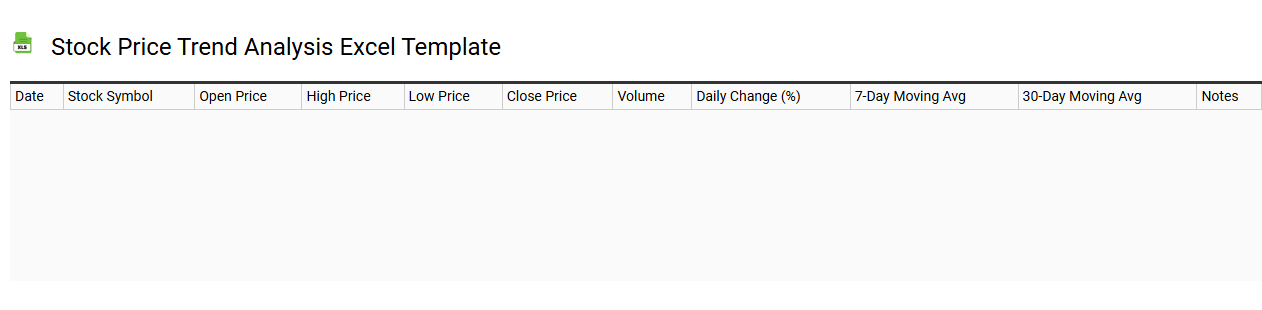
💾 Stock price trend analysis Excel template template .xls
A Stock price trend analysis Excel template is a comprehensive tool designed to help you track and visualize stock performance over time. This template typically includes features like price charts, moving averages, and historical data tables, allowing you to analyze price fluctuations and identify patterns. You can input your stock data, including opening and closing prices, volume traded, and relevant date ranges, to generate insightful graphics that highlight market trends. Such a template is beneficial for basic analysis and can be expanded with advanced functionalities like regression models, technical indicators, and algorithmic trading simulations to enhance your investment strategies.
Expense trend analysis Excel template
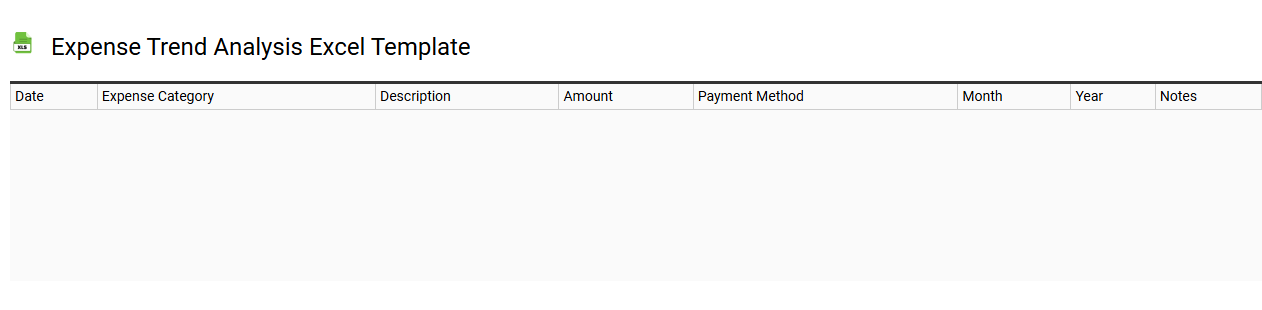
💾 Expense trend analysis Excel template template .xls
An Expense Trend Analysis Excel template is a structured tool designed to help individuals or businesses track, analyze, and visualize their spending habits over a specific period. This template typically includes categories for various expenses, such as utilities, marketing, travel, and payroll, allowing you to enter data systematically. Graphs and charts within the template can showcase trends, highlighting areas of significant expenditure and enabling targeted budgeting strategies. This foundational tool can expand into more advanced financial forecasting and variance analysis, enhancing your overall financial decision-making process.
Website traffic trend analysis Excel template
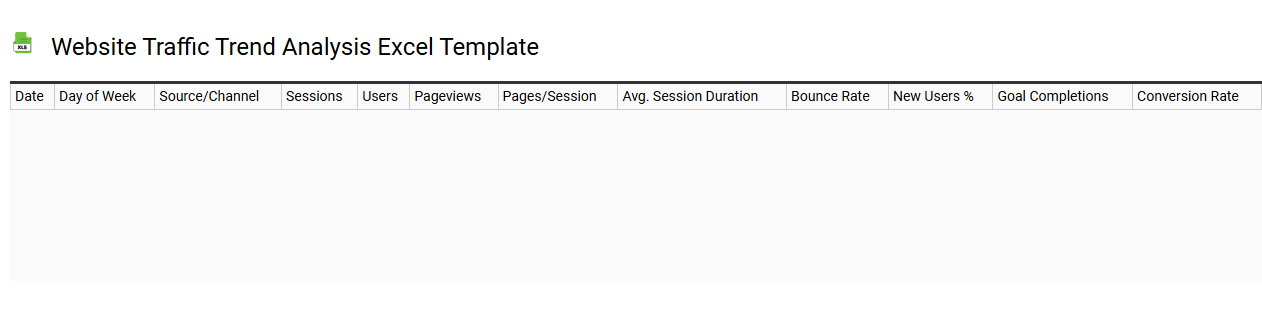
💾 Website traffic trend analysis Excel template template .xls
Website traffic trend analysis Excel templates provide structured frameworks for tracking and interpreting website visitor data over time. These templates typically include various metrics such as unique visitors, page views, bounce rates, and referral sources, allowing you to visualize trends and identify patterns. You can easily customize these templates to meet your specific analytical needs, adding graphs and charts to present your findings effectively. A basic usage of this template can enhance your understanding of user behavior, while further potential involves integrating advanced predictive analytics and machine learning algorithms for deeper insights.
Market trend analysis Excel template
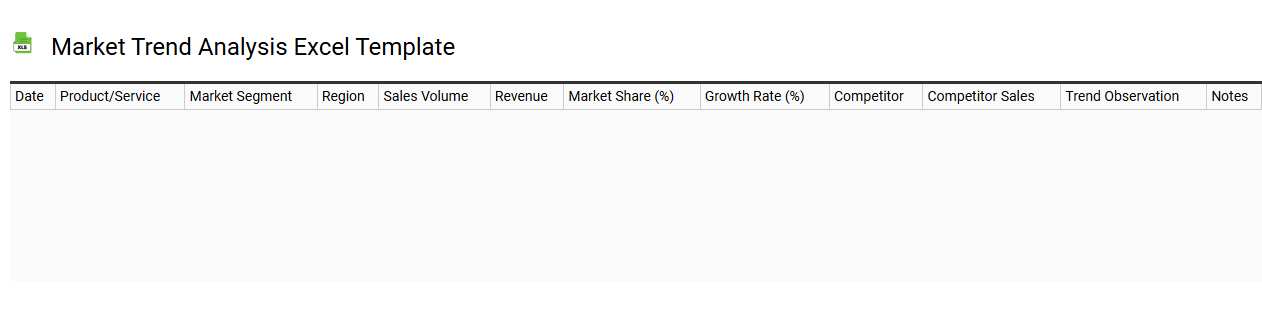
💾 Market trend analysis Excel template template .xls
A Market Trend Analysis Excel template provides a structured framework to evaluate market dynamics and consumer behavior over time. This template typically includes sections for data input, historical trends, forecasts, and visualizations like graphs and charts to illustrate shifts in the market landscape. You can identify patterns and insights that inform strategic decision-making for business growth. For basic usage, it supports tracking sales and market share, while advanced applications may include predictive analytics and machine learning algorithms for deeper market forecasting.
Customer behavior trend analysis Excel template
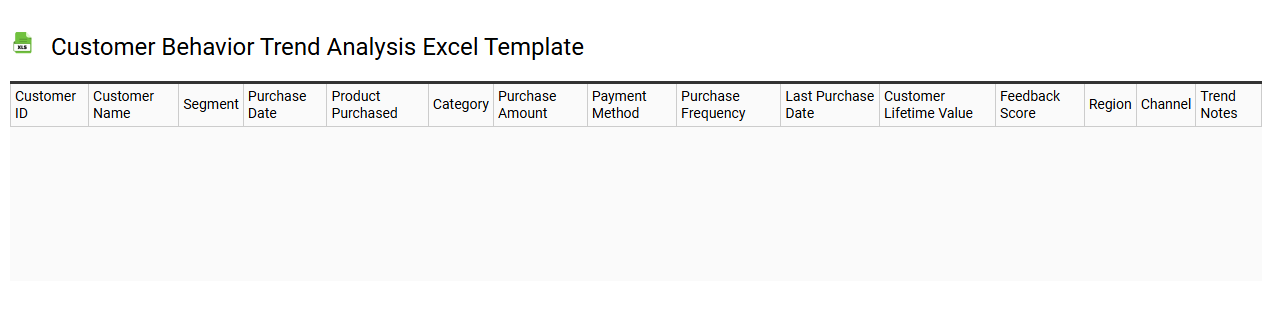
💾 Customer behavior trend analysis Excel template template .xls
A Customer Behavior Trend Analysis Excel template serves as a powerful tool to visualize and interpret customer purchasing patterns over time. It typically includes features like pivot tables, charts, and historical data metrics that allow you to compare sales, demographics, and product preferences. By organizing data in a structured manner, you can easily identify shifts in consumer behavior and segment your audience effectively. This template not only streamlines basic data analysis but can also support advanced analytics such as predictive modeling and clustering techniques to forecast future trends.
Product sales trend analysis Excel template
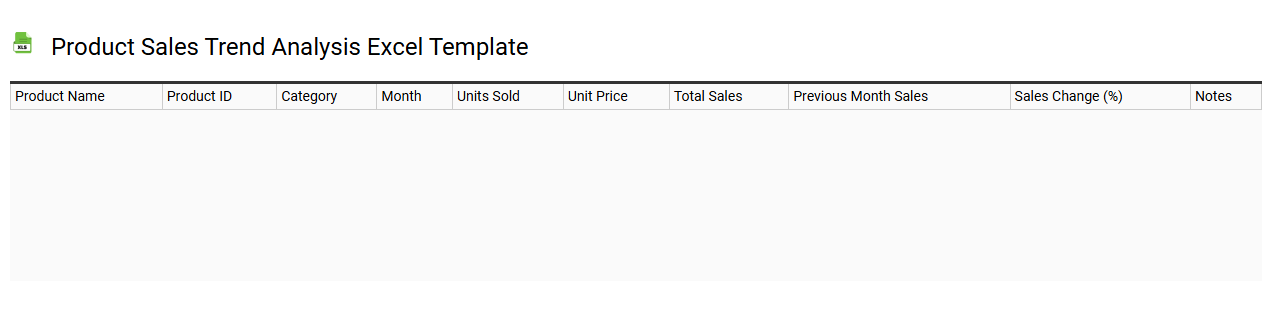
💾 Product sales trend analysis Excel template template .xls
A Product Sales Trend Analysis Excel template allows you to track and visualize the sales performance of various products over time. This template typically includes features such as dynamic charts, pivot tables, and customizable data entry fields, enabling you to easily input daily, monthly, or yearly sales data. By analyzing trends, you can identify peak sales periods, recognize patterns, and forecast future demand, contributing to more informed inventory management and marketing strategies. This tool can serve basic sales tracking needs while also supporting advanced analytics through features like regression analysis and forecasting models.