Discover a collection of free XLS templates designed specifically for stock reporting in Excel. These templates offer structured layouts for tracking inventory levels, monitoring stock movements, and generating insightful reports on stock performance. You can easily customize these templates to suit your specific business needs, ensuring accurate and efficient stock management.
Stock report Excel template for inventory management
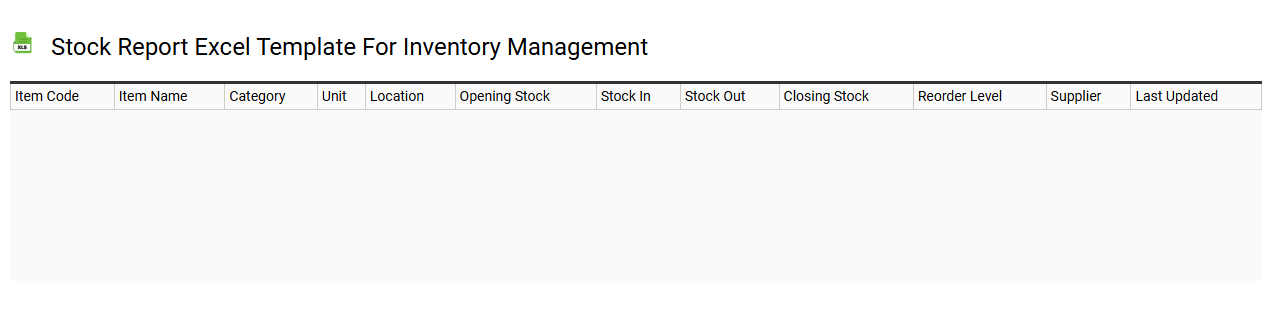
💾 Stock report Excel template for inventory management template .xls
A Stock Report Excel template streamlines inventory management by allowing you to track stock levels, analyze trends, and manage reordering processes effectively. This adaptable tool typically includes columns for item descriptions, quantities on hand, reorder points, and sales history. You can easily customize it to fit your specific needs by adding filters or charts to visualize data trends. Basic usage involves inputting data for existing stock, while potential needs may encompass advanced features like automated alerts or integration with ERP systems for comprehensive inventory control.
Monthly stock report Excel template
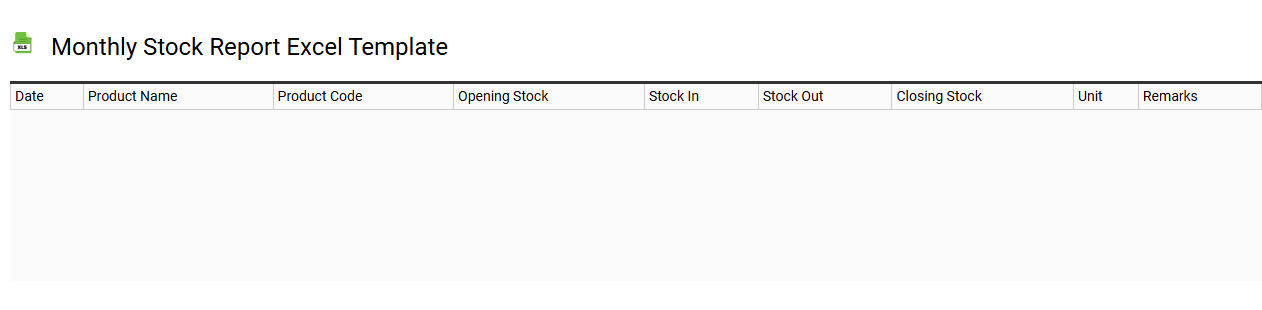
💾 Monthly stock report Excel template template .xls
A Monthly Stock Report Excel template is a structured spreadsheet designed to track, analyze, and manage stock levels over the course of a month. It typically includes columns for item descriptions, stock quantities, reorder levels, and commentary on inventory movement. By utilizing formulas, you can automate calculations to highlight trends, identify slow-moving items, and optimize reorder timings. This template serves as a foundational tool for inventory management, with potential expansions into advanced inventory forecasting models or integration with supply chain management software.
Stock report Excel template with charts
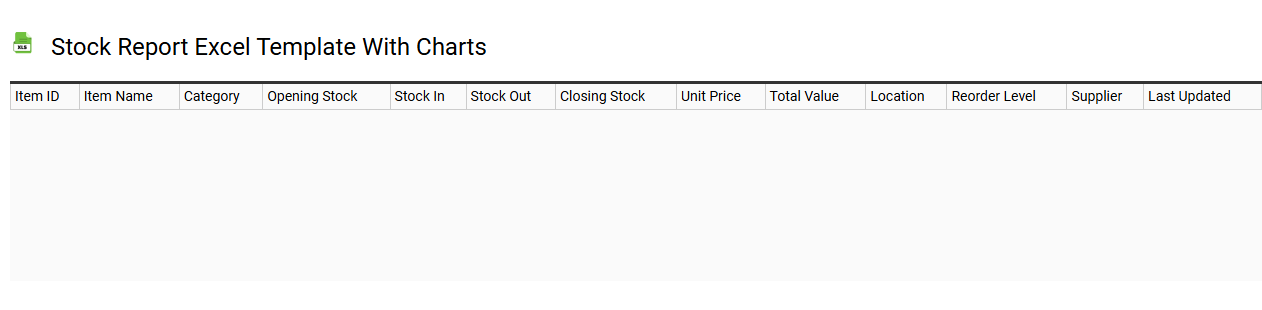
💾 Stock report Excel template with charts template .xls
A Stock Report Excel template with charts is a comprehensive tool designed to help you track and analyze stock performance over time. This template typically includes sections for recording stock purchases, sales, dividends, and current market prices, allowing for easy monitoring of your investment portfolio. Visual representations such as line graphs and bar charts provide insights into stock trends, performance comparisons, and historical data, enhancing your ability to make informed decisions. Basic usage includes tracking individual stocks and performance metrics, while advanced applications could involve integrating financial modeling or predictive analytics for future market trends.
Stock report Excel template for warehouse
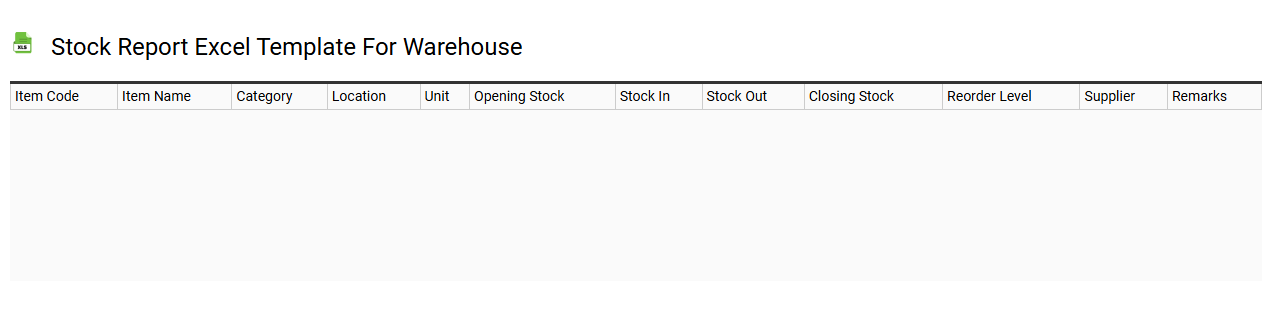
💾 Stock report Excel template for warehouse template .xls
A Stock Report Excel template for a warehouse serves as a vital tool for inventory management, providing a structured method to track stock levels, categorize items, and monitor reorder points. This template typically includes essential columns such as Item Name, SKU (Stock Keeping Unit), Quantity on Hand, Location, and Reorder Level, allowing you to swiftly assess the state of your inventory. Visual elements like charts or conditional formatting can enhance the clarity of data, making it easier to identify trends and discrepancies. Basic usage of this template supports effective inventory control, while further potential needs might include integration with ERP systems or advanced analytics for demand forecasting.
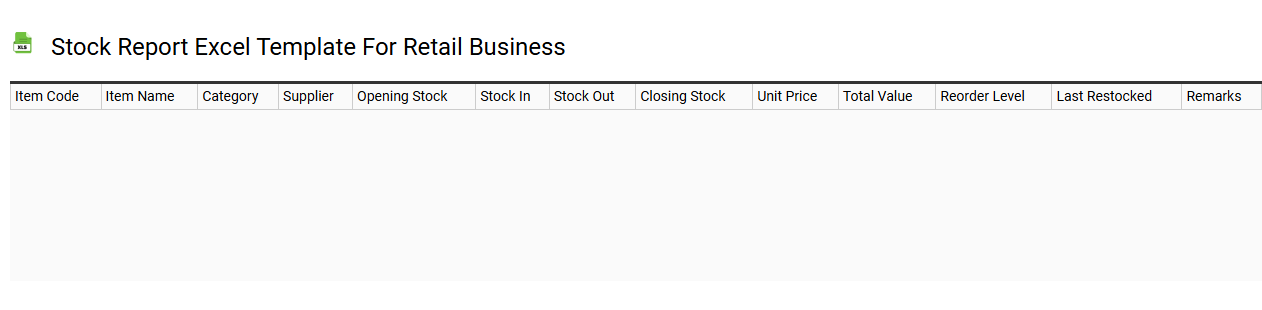
Stock report Excel template for retail business
💾 Stock report Excel template for retail business template .xls
A Stock report Excel template for retail businesses is a structured spreadsheet designed to monitor inventory levels, track sales, and manage stock across multiple products. It typically includes columns for product names, SKU numbers, quantities on hand, reorder levels, and sales data, enabling you to quickly assess which items are performing well. The template can also feature graphs and charts that visualize stock levels over time, helping you make informed purchasing decisions. This tool's basic usage can evolve into advanced inventory management techniques, such as predictive analytics and demand forecasting, tailored to optimize your retail operations further.
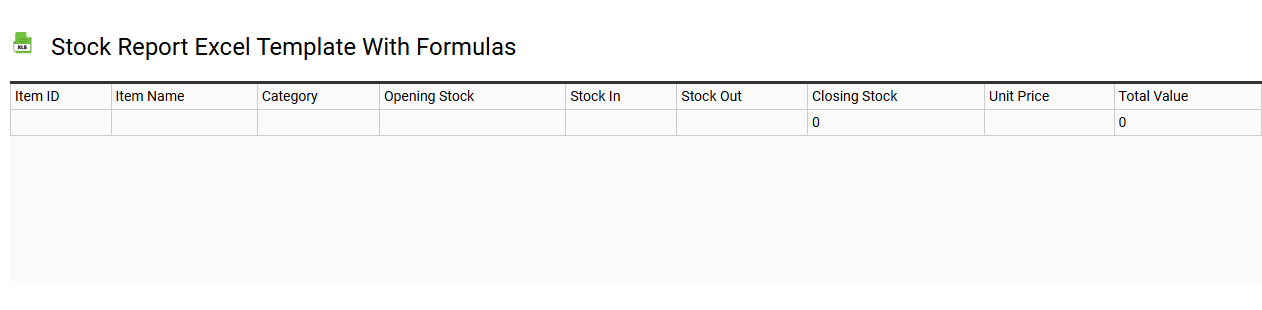
Stock report Excel template with formulas
💾 Stock report Excel template with formulas template .xls
A Stock Report Excel template with formulas serves as an organized tool for tracking inventory levels, sales, and reordering needs. Users can input stock items, quantities, prices, and other relevant metrics, while built-in formulas automatically calculate total values, stock turnover rates, and reorder points. Visual indicators, such as conditional formatting, can highlight products that are below reorder levels, offering quick insights into stock status. This template's basic functions can evolve into more advanced usage scenarios, such as integrating with data analytics for forecasting or leveraging VBA for automation.
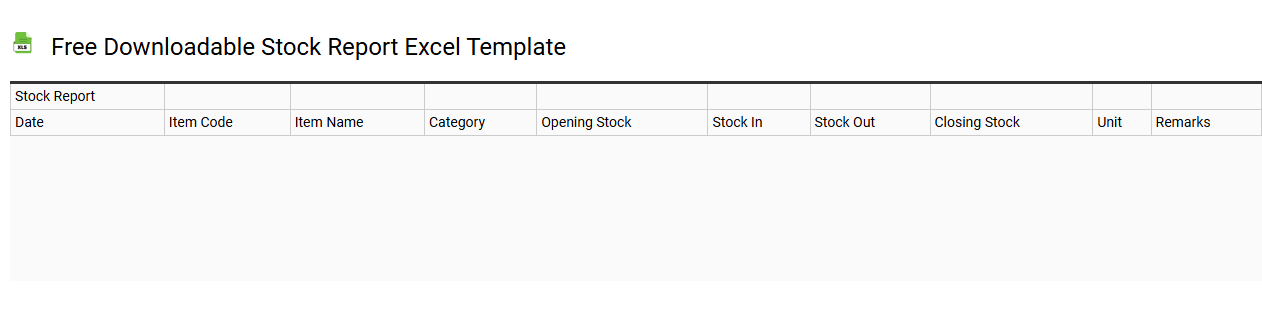
Free downloadable stock report Excel template
💾 Free downloadable stock report Excel template template .xls
A free downloadable stock report Excel template serves as a structured tool for organizing and analyzing stock data. This template typically includes pre-built sections for tracking stock symbols, purchase prices, current values, and overall performance metrics. Users can customize the layout, enabling the incorporation of essential indicators such as dividends and gains or losses. This efficient resource not only facilitates basic portfolio management but can also be adapted for advanced analyses like trend forecasting and risk assessment using complex formulas and visualizations.
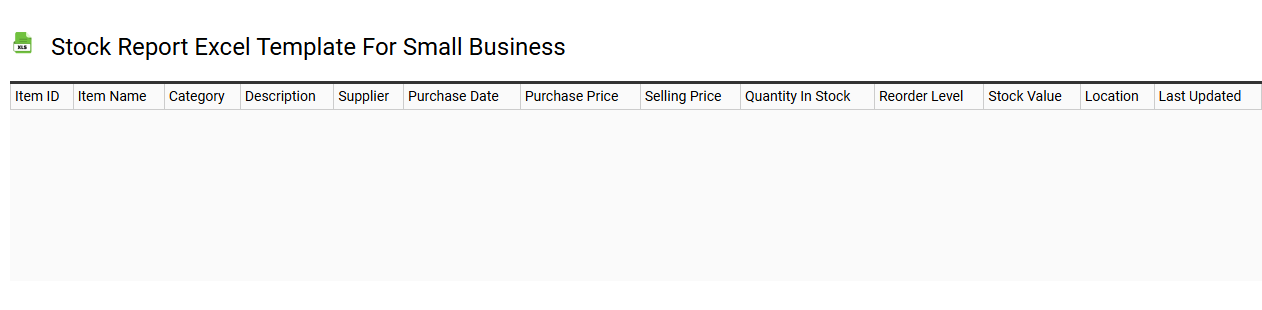
Stock report Excel template for small business
💾 Stock report Excel template for small business template .xls
A Stock Report Excel template for small businesses serves as a vital tool for managing inventory efficiently. It typically includes columns for item name, quantity in stock, reorder level, cost per item, and total value, allowing you to track inventory levels at a glance. This organized layout enables you to identify stock shortages and prevents overstocking, ultimately maximizing your operational efficiency. As your business grows, utilizing advanced Excel functions such as pivot tables, macros, and data validation can further enhance your inventory tracking capabilities.
Stock report Excel template for daily tracking
![]()
💾 Stock report Excel template for daily tracking template .xls
A Stock Report Excel template for daily tracking is a powerful tool designed to monitor and evaluate stock performance efficiently. It typically includes key data fields such as stock symbols, opening and closing prices, daily high and low values, and volume traded, all neatly organized in columns for easy access. The template often features built-in formulas that automatically calculate essential metrics like percentage change and total value, providing you with immediate insights into your investments. With this structure, users can customize the template further to incorporate advanced analytics like moving averages and trend lines for deeper market analysis and forecasting.
Editable stock report Excel template
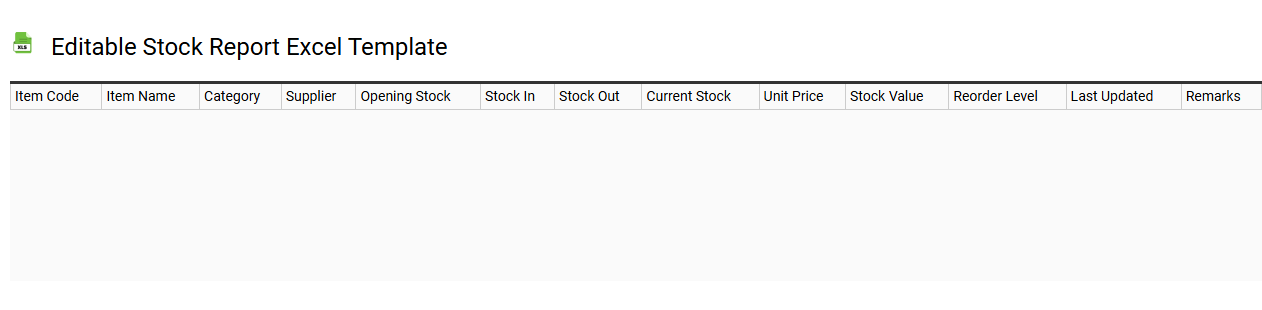
💾 Editable stock report Excel template template .xls
An editable stock report Excel template provides a structured format for tracking inventory levels, sales performance, and reorder points in real-time. This template typically includes columns for item names, stock quantities, prices, and supplier information, allowing for easy data entry and management. You can customize it by adding formulas for automated calculations, such as total value or turnover rates, enhancing efficiency and accuracy. The basic usage of such a template helps in efficient inventory management, with potential to integrate advanced features like forecasting algorithms and dynamic dashboards for deeper insights.