Explore a range of free XLS templates designed specifically for sales analysis reports in Excel. These templates offer structured layouts, allowing you to easily input data and visualize sales trends through charts and graphs. Utilize features like automated calculations and customizable sections to tailor the report according to your specific business needs, enhancing your ability to track performance and make informed decisions.
Sales analysis report Excel template for monthly sales
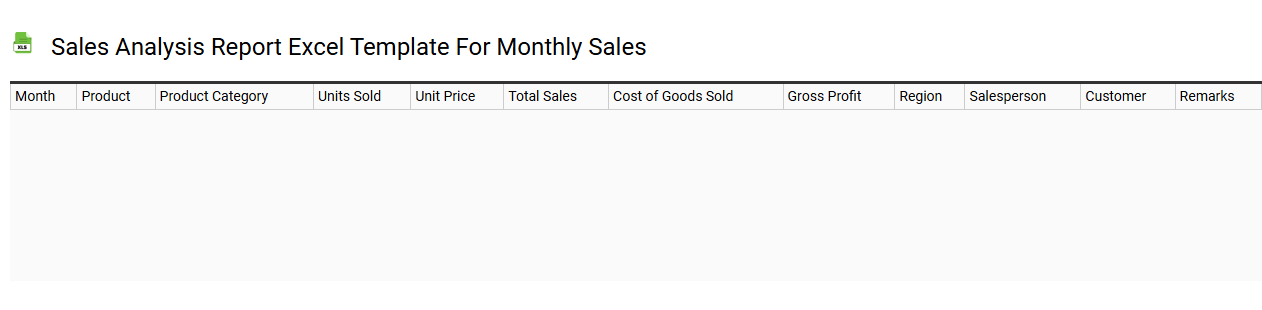
💾 Sales analysis report Excel template for monthly sales template .xls
A Sales Analysis Report Excel template for monthly sales systematically organizes and visually represents sales data, enabling businesses to track performance trends. It typically includes essential metrics such as total sales volume, revenue generated, top-selling products, and sales by region or sales representative. Detailed charts and graphs in the template facilitate quick insights, helping you make informed decisions on sales strategies. This tool not only enhances the understanding of past performance but also assists in forecasting future sales, identifying potential areas for growth, and examining advanced analytics like predictive modeling or sales funnel optimization.
Product-wise sales analysis Excel template
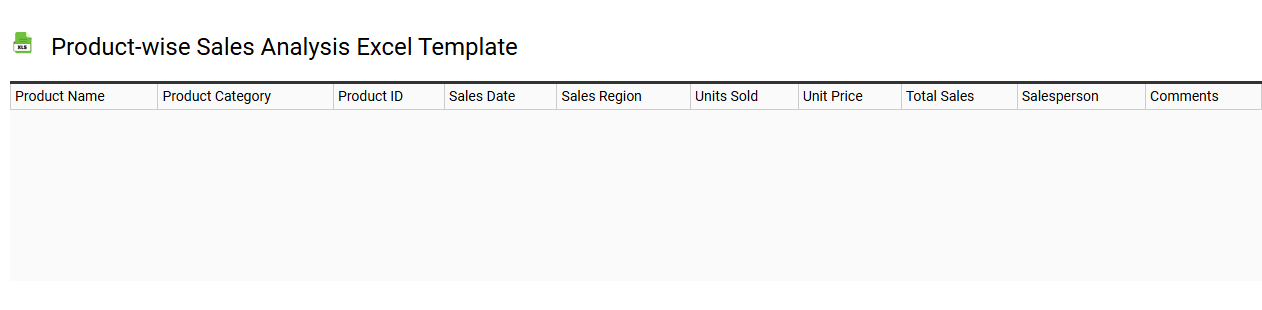
💾 Product-wise sales analysis Excel template template .xls
A Product-wise sales analysis Excel template provides a structured format for evaluating sales performance across various products. This template typically includes columns for product names, sales volumes, revenue figures, and profit margins, allowing for easy comparison and trend identification. You can also incorporate charts and graphs to visualize data, enhancing your understanding of which products perform best over specified periods. This kind of analysis can assist in identifying potential areas for growth, inventory management, and marketing strategies, paving the way for advanced analytics, such as predictive modeling or sales forecasting.
Regional sales analysis report Excel template
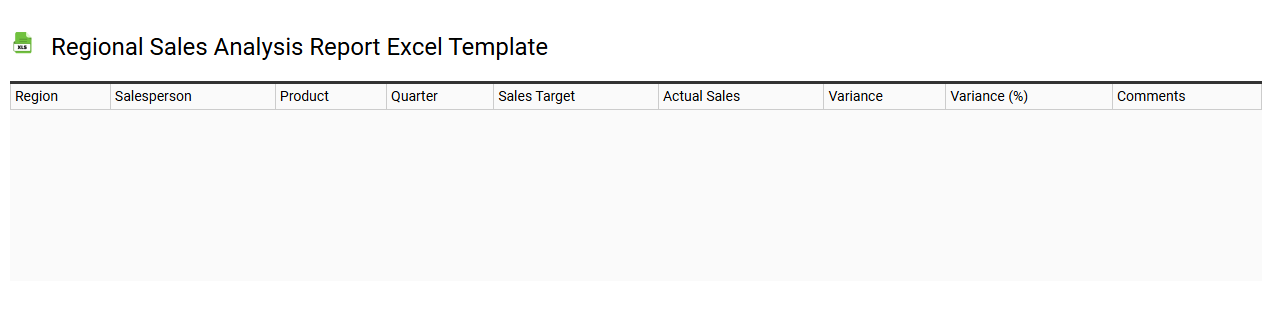
💾 Regional sales analysis report Excel template template .xls
A Regional Sales Analysis Report Excel template is a structured tool designed to help businesses evaluate sales performance across different geographical areas. It typically includes various sections for inputting data like sales figures, targets, growth percentages, and comparisons with past performance. The template often features charts and graphs that visually represent sales trends, making it easier for you to identify patterns and insights at a glance. This foundational tool can evolve to accommodate advanced analytics, such as predictive modeling or geographic information system (GIS) functionalities, to further enhance decision-making processes.
Yearly sales analysis summary Excel template
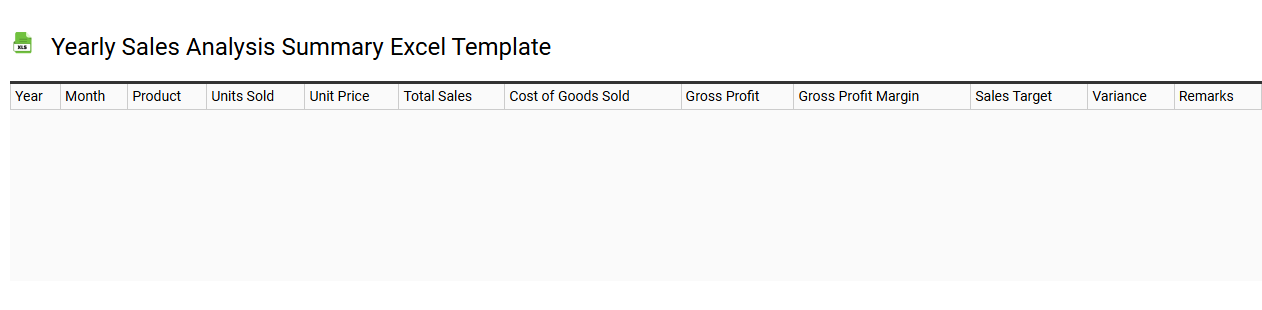
💾 Yearly sales analysis summary Excel template template .xls
A Yearly Sales Analysis Summary Excel template is a structured worksheet designed to help businesses track and evaluate their sales performance over an entire year. This template typically includes sections for sales data breakdown by month, product category, or sales territory, allowing for a clear visual representation of trends and patterns. You can input various metrics, such as total revenue, average sales per month, and percentage growth compared to the previous year, facilitating informed decision-making. This basic tool can evolve into advanced analytics solutions, incorporating predictive modeling and complex data visualizations to further enhance your sales strategies.
Sales trend analysis report Excel template
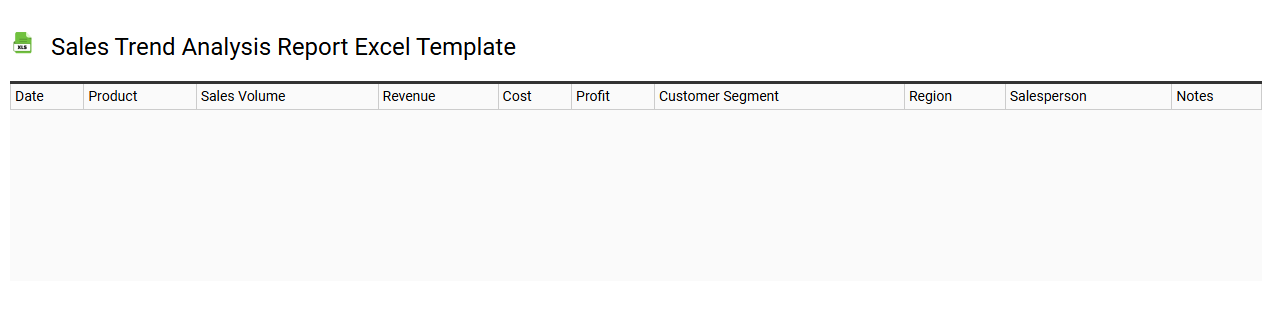
💾 Sales trend analysis report Excel template template .xls
A Sales Trend Analysis Report Excel template is a structured tool designed to help you visualize and interpret sales data over a specified period. It incorporates features like graphs, charts, and pivot tables to illustrate patterns, peak sales seasons, and overall performance metrics. The template allows you to organize data such as monthly sales figures, product categories, and regional performance for clear comparison and analysis. By utilizing this template, you can identify growth opportunities, forecast future sales, and adjust your strategies effectively, while advanced capabilities may include predictive analytics and machine learning integrations for deeper insights.
Daily sales analysis report Excel template
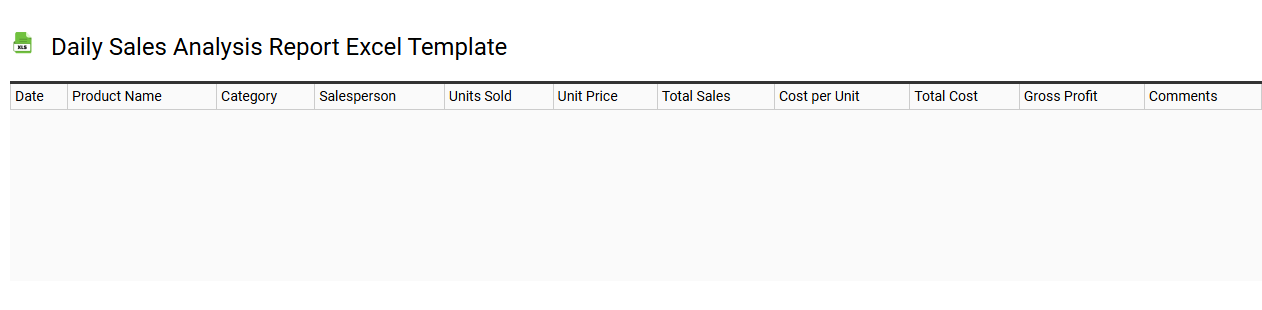
💾 Daily sales analysis report Excel template template .xls
A Daily Sales Analysis Report Excel template is a structured tool used by businesses to track and analyze their daily sales performance. It typically includes sections for recording sales figures, revenue, refunds, and returns, enabling you to assess trends over time. This template often features visual elements like charts and graphs to provide insights at a glance, making it easier to identify patterns and inform your sales strategies. Utilizing this template can help you identify potential needs such as forecasting, stock management, or even more sophisticated analytics techniques like predictive modeling.
Comparative sales analysis Excel template
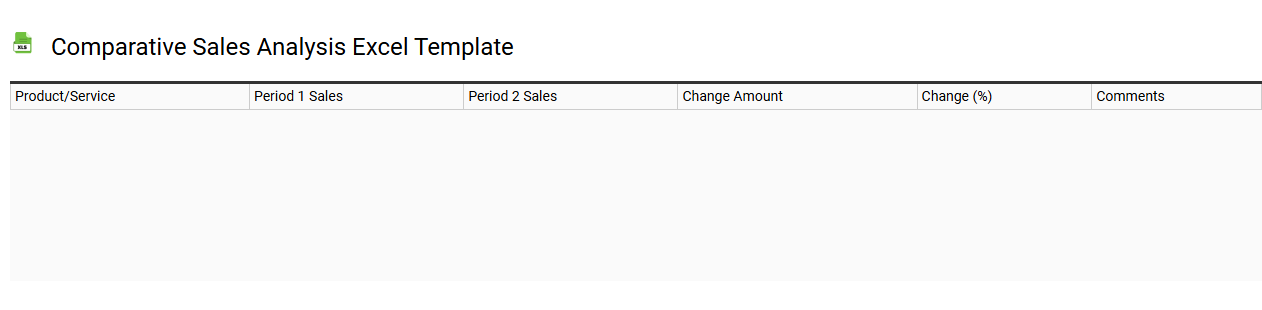
💾 Comparative sales analysis Excel template template .xls
A Comparative Sales Analysis Excel template is a structured tool designed to help businesses evaluate their sales performance over specific periods or between different products or regions. It typically includes features like sales data entry, charts for visual representation, and formulas for calculating growth rates and performance metrics. This template allows you to identify trends, strengths, and weaknesses in your sales strategy. You can use this essential tool for performance tracking or delve deeper into complex analyses like predictive modeling and market segmentation.
Sales data analysis dashboard Excel template
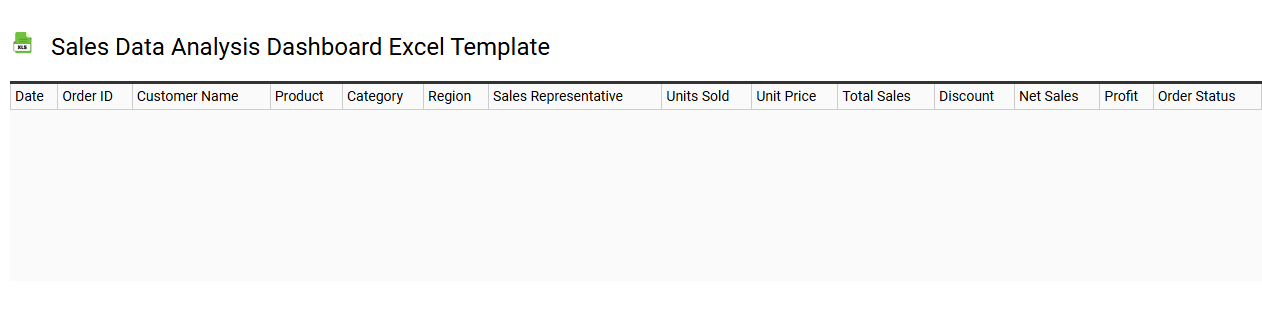
💾 Sales data analysis dashboard Excel template template .xls
A Sales data analysis dashboard Excel template is a pre-designed tool that helps you visualize and interpret your sales performance data efficiently. It typically includes interactive charts, graphs, and tables that summarize key metrics such as total sales, average transaction value, and sales by product or region. You can customize these elements to track specific performance indicators that matter most to your business. This template serves as a foundational tool for understanding trends, but you can enhance its functionality by incorporating advanced forecasting methods, regression analysis, or machine learning algorithms to predict future sales patterns.
Sales vs target analysis Excel template
💾 Sales vs target analysis Excel template template .xls
A Sales vs. Target Analysis Excel template is a powerful tool that helps track and visualize sales performance against predefined targets. This template typically includes columns for months, actual sales figures, and target sales numbers, allowing for a straightforward comparison. Graphical representations, such as bar charts or line graphs, provide a quick visual assessment of performance trends over time, enabling you to spot areas needing improvement. By utilizing this template, you can easily analyze data for current performance and identify advanced analytics needs like predictive modeling or segmentation strategies for future sales growth.