Explore an array of free XLS templates designed specifically for growth analysis. These templates offer structured layouts that allow you to input data efficiently, making it easy to track and evaluate growth metrics. Each template typically includes sections for key performance indicators, visual charts, and customizable formulas to suit your specific analysis needs.
Sales growth analysis Excel template
💾 Sales growth analysis Excel template template .xls
Sales growth analysis Excel templates are pre-designed spreadsheets that assist in evaluating the increase or decrease in sales over a specific period. These templates typically include various charts and graphs to visualize trends, allowing for quick assessment of performance metrics such as year-over-year growth, monthly growth rates, and sales forecasts. Users can input their sales data, making it easy to compare actual results against targets or previous periods for improved decision-making. For foundational uses like tracking sales trends or identifying peak performance times, you might explore more advanced analytics features, such as predictive modeling and multi-variable regression.
Revenue growth tracking Excel template
![]()
💾 Revenue growth tracking Excel template template .xls
A Revenue Growth Tracking Excel template is a tool designed to help businesses monitor and analyze their revenue trends over time. It typically includes fields for inputting monthly or quarterly revenue figures, allowing you to visualize performance through charts and graphs. The template may also offer features for calculating growth percentages, identifying trends, and setting future revenue targets. Using this template can guide your strategic decision-making and reveal areas for potential optimization, with advanced capabilities like forecasting and multi-variable scenario analysis for deeper insights.
Monthly growth rate calculation Excel template
💾 Monthly growth rate calculation Excel template template .xls
A Monthly Growth Rate Calculation Excel template serves as a valuable tool for analyzing the growth of a business over a specific timeframe. This template typically includes sections for entering your revenue or key performance indicators (KPIs) for each month, allowing you to easily track changes. Formulas within the template automatically compute the growth rates by comparing one month's performance to the previous month's statistics. Your ability to visualize trends through charts and tables enhances data interpretation, facilitating strategic decision-making while keeping in mind advanced analytics like compound growth or seasonality adjustments for future needs.
Customer growth analysis Excel template
💾 Customer growth analysis Excel template template .xls
Customer growth analysis Excel templates serve as powerful tools for businesses aiming to evaluate their customer base expansion over time. These templates typically include key metrics such as customer acquisition rates, retention rates, and overall growth percentages. Graphical representations, like charts and graphs, provide intuitive visualizations, making it easier to spot trends and patterns in customer behavior. Such templates are beneficial for basic usage, while advanced features can include predictive analytics, cohort analysis, and customer lifetime value assessments to further enhance strategic decision-making.
Year-over-year growth Excel template
💾 Year-over-year growth Excel template template .xls
Year-over-year growth Excel template is a structured tool designed for tracking and analyzing annual performance changes in various metrics, such as revenue, profits, or user engagement. This template enables you to input your data for different years, automatically calculating the percentage increase or decrease over time. You can visualize the growth trends through charts and graphs, making it easier to present your findings in reports or meetings. As you gain familiarity with this template, you may explore advanced techniques like regression analysis or forecasting to enhance your financial analyses and decision-making processes.
Business growth dashboard Excel template
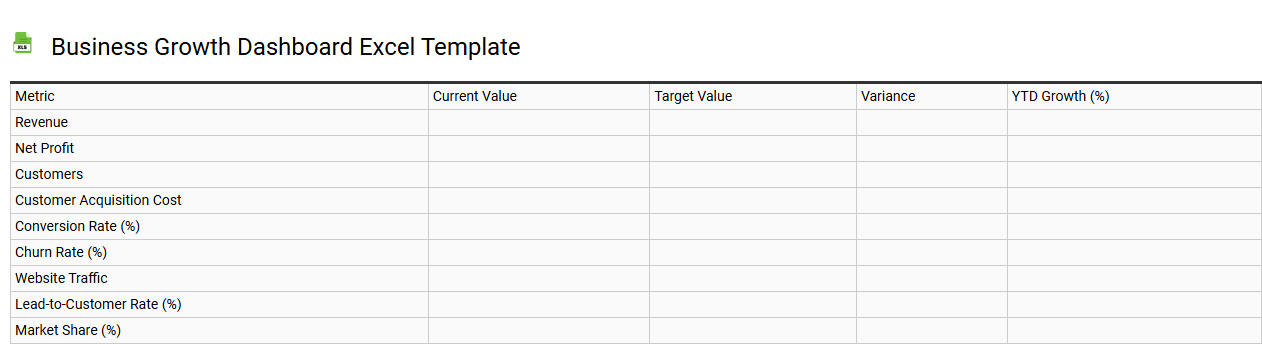
💾 Business growth dashboard Excel template template .xls
A Business Growth Dashboard Excel template serves as a visual tool that consolidates essential performance indicators, helping businesses track progress and make informed decisions. It typically features a combination of graphs, charts, and tables that illustrate metrics such as sales growth, customer acquisition, and market share. Your data can be easily inputted, providing real-time insights into trends and areas needing improvement. While basic functionalities like tracking revenue are beneficial, advanced capabilities may include predictive analytics and integration with data visualization software for deeper analysis.
Profit growth comparison Excel template
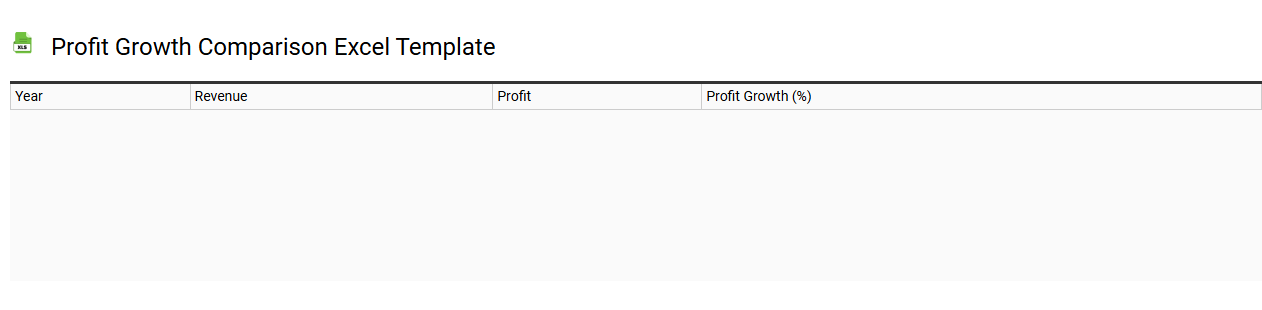
💾 Profit growth comparison Excel template template .xls
A Profit Growth Comparison Excel template is a structured tool that helps you analyze and visualize the growth of profits over specific periods. It typically includes key metrics, such as revenue, expenses, and net profit, allowing for side-by-side comparisons of different time frames or business units. This template can enable you to identify trends and assess the effectiveness of your business strategies in driving profitability. You can use it for basic analysis or expand its functionality with advanced features like forecasting, sensitivity analysis, or integration with business intelligence tools.
Startup growth analysis Excel template
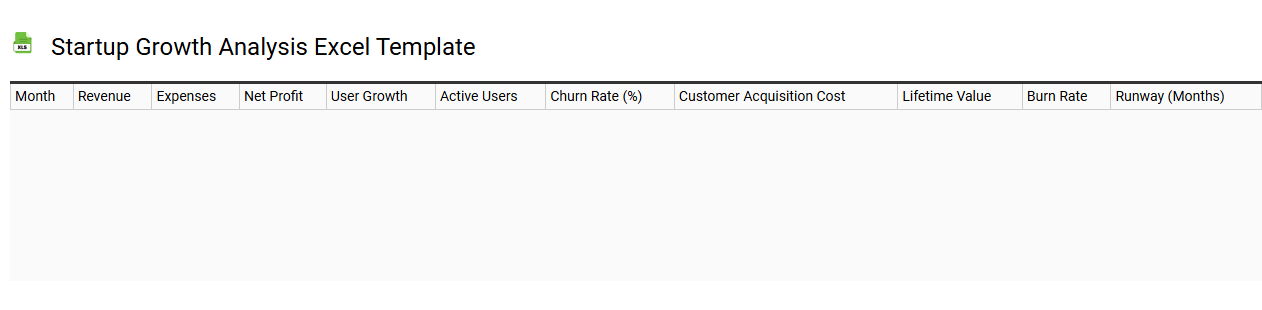
💾 Startup growth analysis Excel template template .xls
A Startup Growth Analysis Excel template serves as a powerful tool for entrepreneurs looking to evaluate and project their business growth. You can track key performance indicators (KPIs) such as revenue, customer acquisition, and churn rates, enabling you to make data-driven decisions. The template often includes dynamic charts and graphs that visually represent growth trends, making it easier to communicate progress to stakeholders. As your startup evolves, this template can support advanced analyses, including predictive modeling and cohort analysis for deeper insights into customer behavior.
Financial growth analysis Excel template
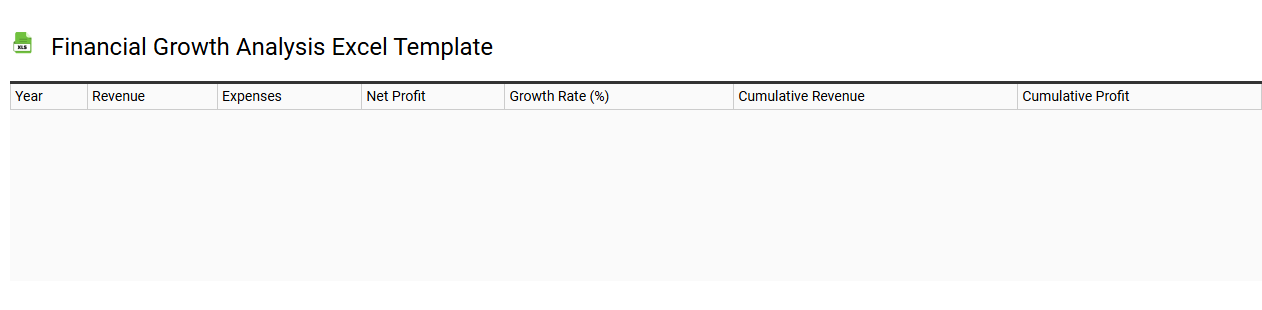
💾 Financial growth analysis Excel template template .xls
A Financial Growth Analysis Excel template is a structured tool designed to help individuals or businesses evaluate their financial progress over time. This template typically includes various sheets for tracking income, expenditures, profit margins, and growth rates, allowing users to make informed decisions. With built-in formulas and charts, it visually represents data trends, enhancing your understanding of financial health and future projections. By employing this template, you can perform basic financial assessments and scale your analysis to incorporate advanced metrics such as compound annual growth rate (CAGR) and net present value (NPV).
Website traffic growth Excel template
💾 Website traffic growth Excel template template .xls
A Website Traffic Growth Excel template is a structured tool designed to help you track and analyze the traffic flowing to your website over time. This template typically includes various metrics such as page views, unique visitors, bounce rates, and sources of traffic, allowing you to visualize trends and patterns effectively. You can customize the template to reflect specific periods, enabling monthly, quarterly, or yearly comparisons to assess the impact of your marketing efforts. By utilizing this data, you can identify areas for improvement and strategize future initiatives, possibly expanding into advanced analytics like conversion rate optimization and customer journey mapping.