Explore a diverse range of free XLS templates designed specifically for creating performance charts in Excel. These templates provide easy-to-use frameworks that allow you to visualize data effectively, track progress over time, and analyze performance metrics in a clear and organized manner. Tailored for various industries and needs, you'll find options that handle everything from sales performance to project management, empowering you to present data compellingly.
Performance chart Excel template for employee evaluation
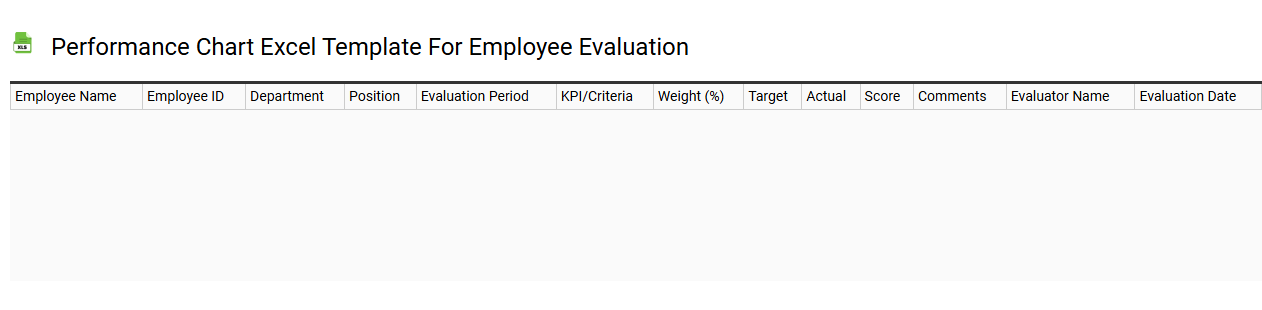
💾 Performance chart Excel template for employee evaluation template .xls
A Performance Chart Excel template for employee evaluation provides a structured format for assessing staff performance over a specified period. This template typically includes metrics such as productivity, goal achievement, and skill development, allowing you to visualize performance trends with graphs and charts. Users can easily input data relating to individual employee contributions, making it simple to compare performance across teams or departments. Leveraging this template can enhance your evaluation process, while advanced users might explore integration with business intelligence tools or automation for real-time data analysis.
Monthly sales performance chart Excel template
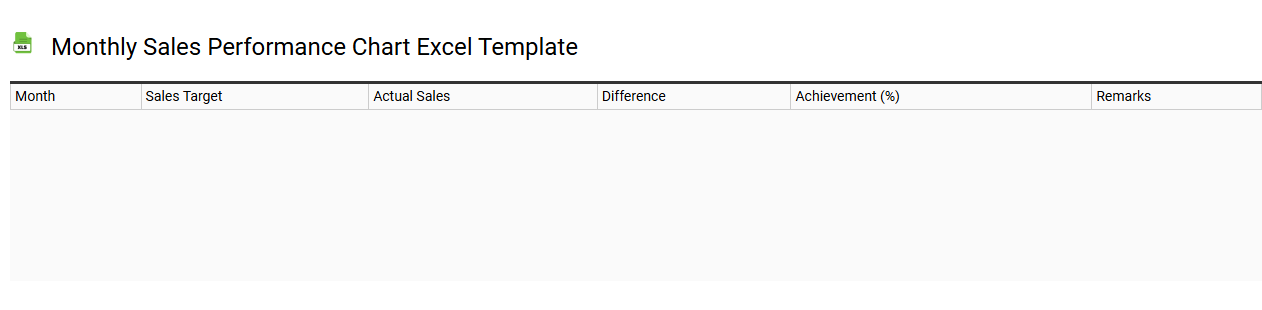
💾 Monthly sales performance chart Excel template template .xls
A Monthly Sales Performance Chart Excel template visually represents sales data over a specified period, typically organized by month. This chart allows businesses to track trends, compare performance against targets, and assess seasonal patterns. Your sales team can easily create interactive charts using Excel's built-in features, helping to identify peak sales periods and underperforming months. The template can further be customized to analyze advanced metrics like year-over-year growth or sales forecasting based on historical data.
KPI performance chart Excel template for business
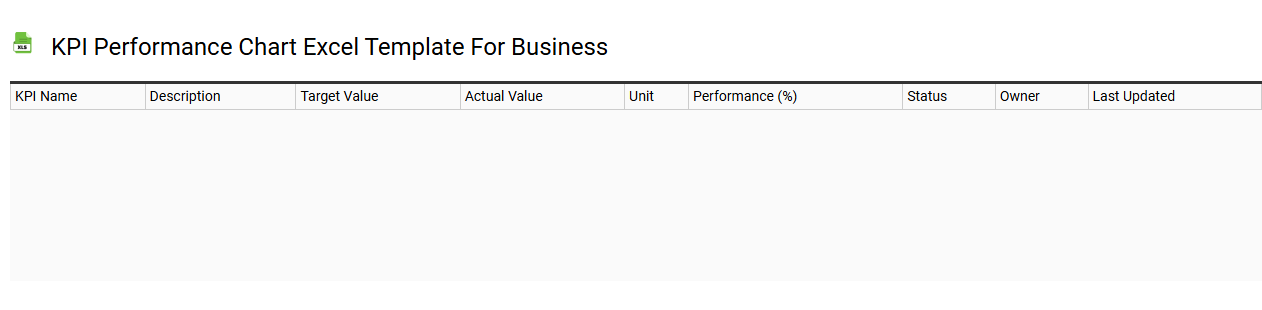
💾 KPI performance chart Excel template for business template .xls
A KPI (Key Performance Indicator) performance chart in Excel serves as a visual tool for tracking and analyzing business metrics over time. This template typically includes various KPIs tailored specifically to your industry, such as sales growth, customer retention, or operational efficiency. You can customize the chart with your data, allowing for real-time updates and comprehensive performance insights. Basic usage of this template helps you monitor performance, while advanced features like forecasting, trend analysis, and integration with other data sources can enhance decision-making processes.
Project performance chart Excel template for tracking
![]()
💾 Project performance chart Excel template for tracking template .xls
The Project Performance Chart Excel template serves as a vital tool for monitoring and analyzing project progress. It provides a visual representation of key metrics such as timelines, budgets, and resource allocation, enabling you to quickly assess whether a project is on track. Each element of the chart is customizable, allowing for the inclusion of specific data points relevant to your unique project requirements. For everyday use, this template can help manage projects effectively, while further customization could include advanced analytics like earned value management or predictive performance trends.
Academic performance chart Excel template for students
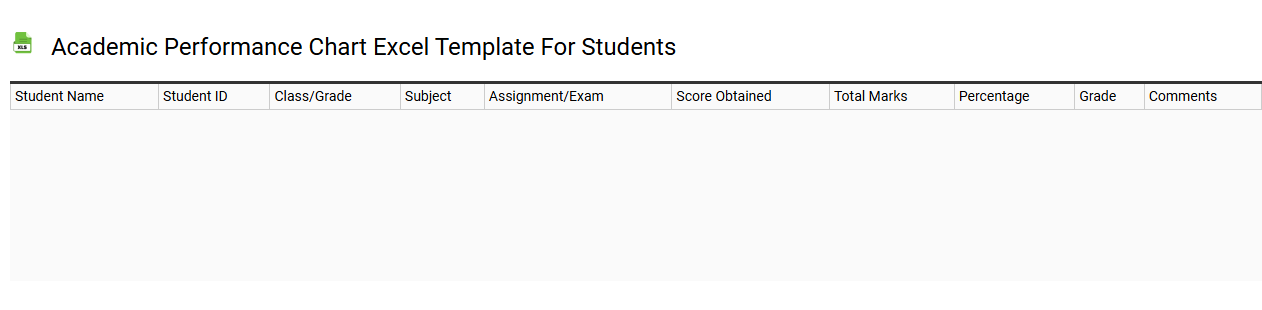
💾 Academic performance chart Excel template for students template .xls
An Academic Performance Chart Excel template for students is a structured tool designed to help track and visualize academic progress. This template typically includes various subjects, grades, attendance, and other performance metrics displayed in an easy-to-understand format. It allows for customization, enabling you to input personal data and evaluate improvements over time. For basic usage, you can monitor grades and trends, while advanced features may include analytics like predictive modeling or comparative performance assessments.
Team performance chart Excel template for managers
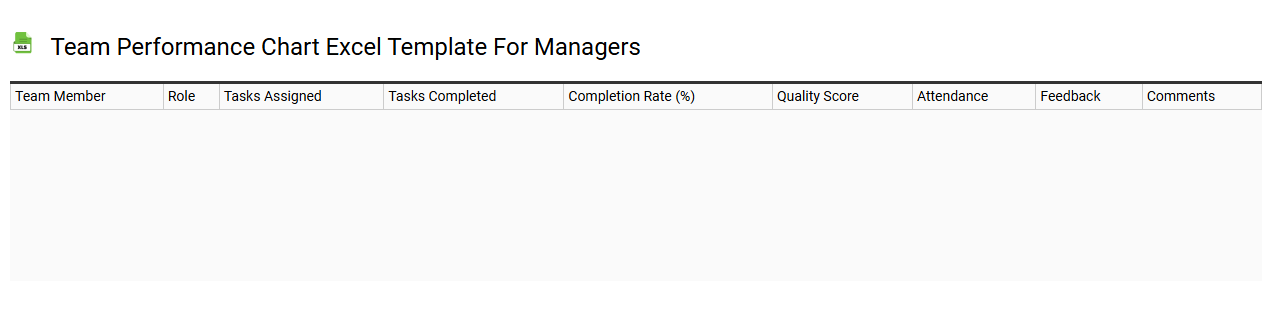
💾 Team performance chart Excel template for managers template .xls
A Team Performance Chart Excel template is a structured tool that helps managers track and analyze their team's performance metrics. This template typically includes various KPIs, such as completion rates, individual contributions, and overall productivity trends, allowing for a visual representation of how well the team is functioning. You can customize the chart to reflect specific goals, timelines, and team dynamics, which aids in identifying strengths and areas needing improvement. Using this template fosters informed decision-making and supports performance enhancement strategies, with more advanced needs potentially involving data analytics and predictive modeling for future projects.
Financial performance chart Excel template for reports
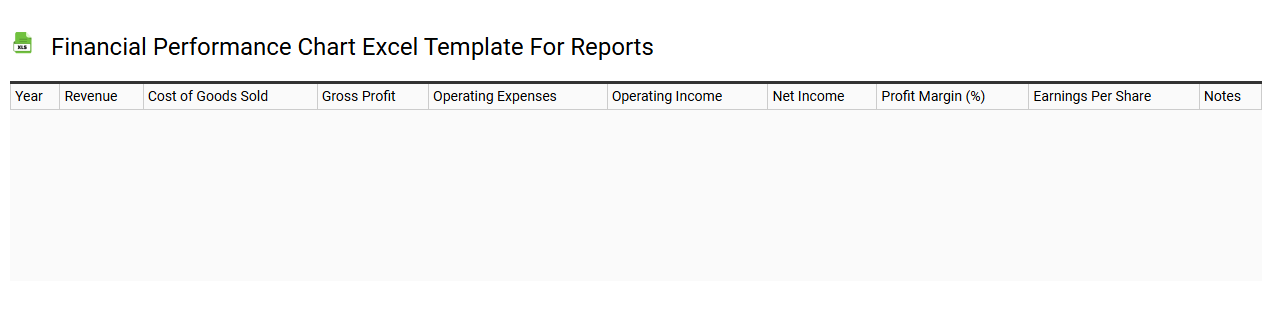
💾 Financial performance chart Excel template for reports template .xls
A Financial Performance Chart Excel template is a pre-designed tool that allows users to visualize and analyze financial data effectively. This template typically includes various charts such as line graphs, bar charts, and pie charts, which represent key financial metrics like revenue, expenses, and profitability over time. Users can input their financial data, and the template automatically updates the charts, enabling quick insights into trends and performance fluctuations. Beyond basic reporting, this template can be customized for advanced financial analyses, incorporating metrics like ROI, EBIT, or cash flow forecasts.
Daily performance chart Excel template for productivity
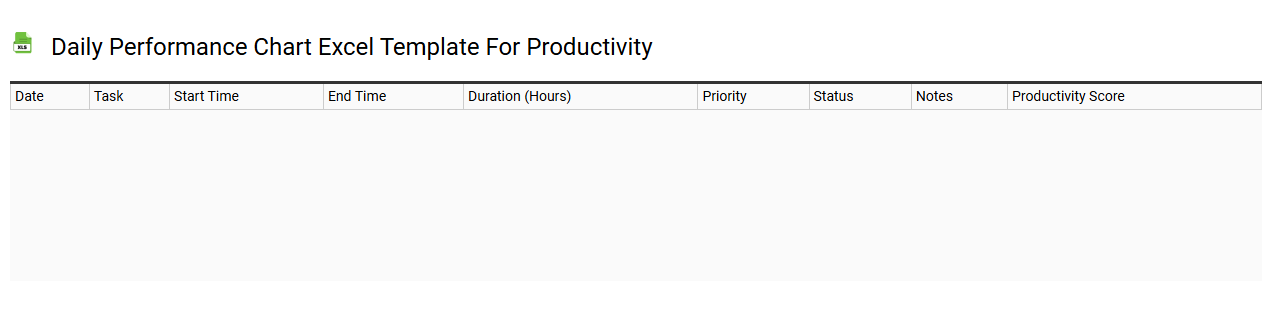
💾 Daily performance chart Excel template for productivity template .xls
The Daily Performance Chart Excel template is a structured tool designed to track and analyze your daily productivity. This template typically includes columns for recording tasks, time spent, completion status, and notes, which allows you to visualize how effectively your time is utilized each day. With features such as color-coded performance indicators and automated calculations, you can quickly identify bottlenecks and areas for improvement. As you become accustomed to its basic usage, exploring advanced functionalities like macros or pivot tables can further enhance your productivity analysis.
Marketing performance chart Excel template for campaigns
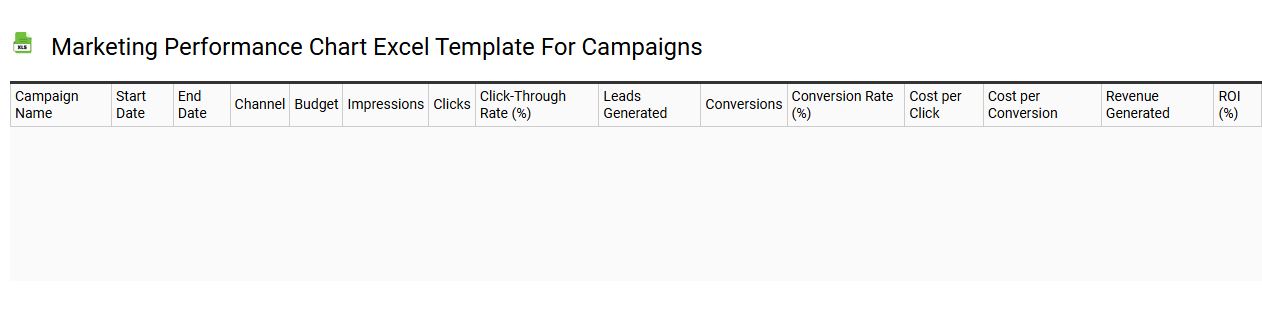
💾 Marketing performance chart Excel template for campaigns template .xls
A Marketing Performance Chart Excel template serves as a vital tool for tracking and analyzing the effectiveness of various marketing campaigns. This template typically features graphs and tables that display key performance indicators (KPIs), such as return on investment (ROI), conversion rates, and customer engagement metrics. By organizing data visually, it allows you to quickly assess which campaigns are performing well and which ones may need adjustments. You can start with basic metrics, but as your analysis needs evolve, consider integrating advanced data analytics techniques, such as predictive modeling and real-time performance tracking.
Yearly performance chart Excel template for company analysis
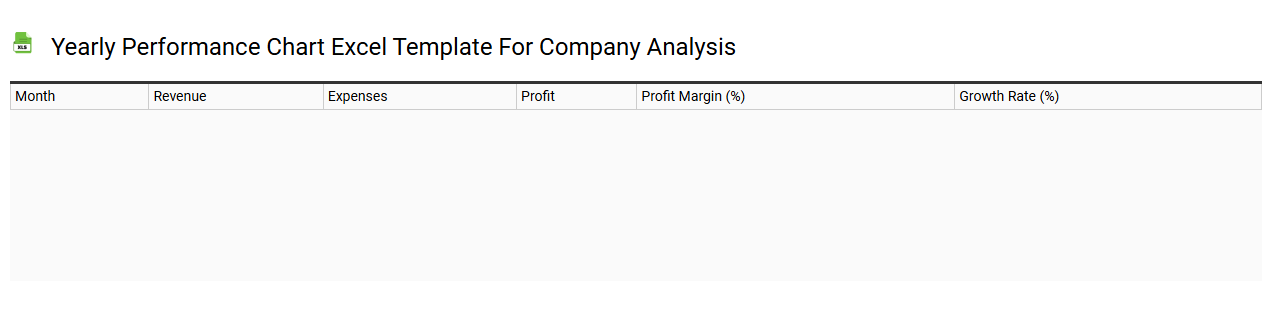
💾 Yearly performance chart Excel template for company analysis template .xls
The yearly performance chart Excel template serves as a visual representation of a company's performance metrics over the course of a year. Key data points, such as revenue, expenses, profit margins, and growth rates, can be easily plotted for quick analysis. This template enhances clarity by allowing you to compare trends, identify patterns, and make data-driven decisions based on your findings. For even more advanced applications, consider integrating forecasting models or predictive analytics to expand your analytical capabilities.