Explore a collection of free XLS templates specifically designed for KPI reporting in Excel, catering to various business needs. Each template features customizable charts, tables, and graphs, allowing you to track your key performance indicators effectively. These user-friendly designs enable you to easily input your data and visualize performance trends, ensuring you stay informed and make data-driven decisions.
Sales KPI dashboard Excel template
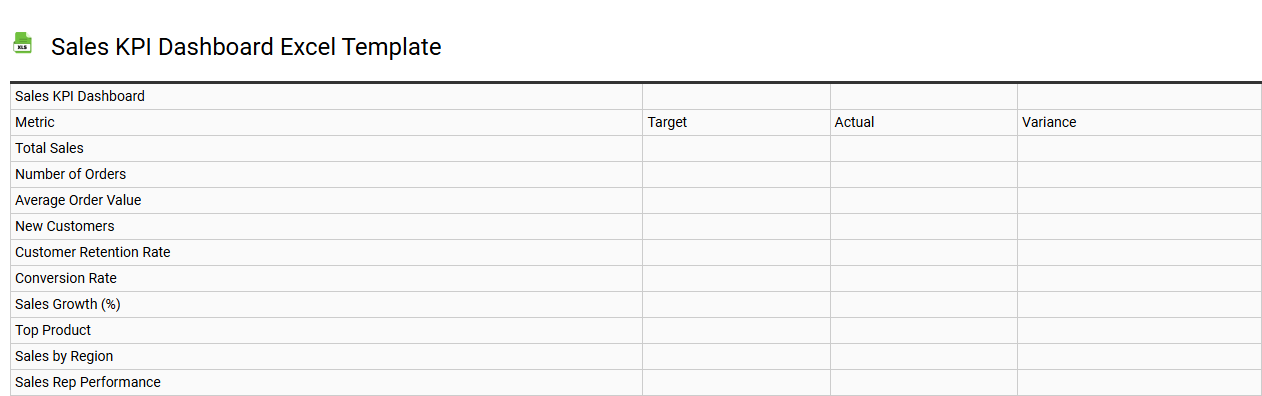
💾 Sales KPI dashboard Excel template template .xls
A Sales KPI dashboard Excel template is an organized tool that visually presents key performance indicators (KPIs) related to sales activities, performance, and goals. This template typically includes graphs, charts, and tables, showcasing metrics such as total sales, sales by product, sales growth trends, and conversion rates, allowing you to quickly assess the effectiveness of your sales strategies. You can customize it to track specific metrics that are relevant to your business objectives, making it a versatile solution for performance monitoring. Beyond basic usage, this template has the potential to incorporate advanced analytics such as predictive modeling and segmentation analysis to enhance decision-making processes.
Monthly KPI report Excel template
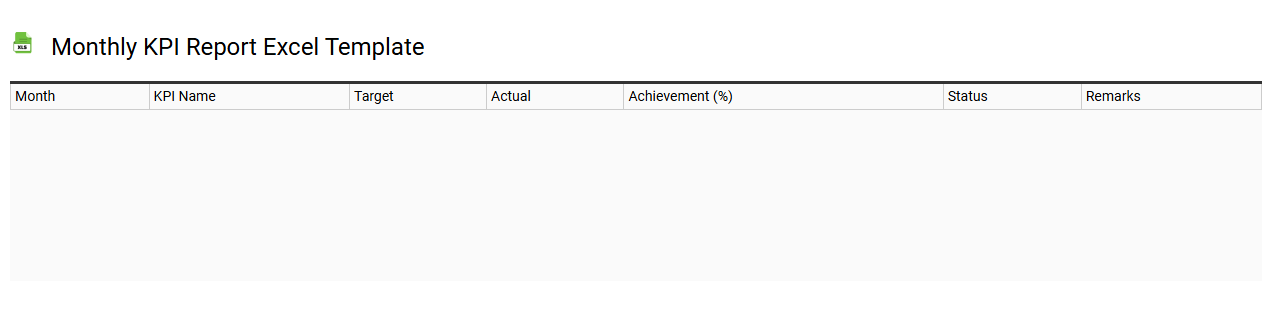
💾 Monthly KPI report Excel template template .xls
A Monthly KPI report Excel template is a structured tool designed to help businesses track and analyze key performance indicators (KPIs) on a monthly basis. It typically includes predefined sections for entering various metrics, such as sales figures, customer engagement rates, and operational efficiency. Visual elements like charts and graphs enhance data representation, making it easier to identify trends and areas for improvement. Such a template can be customized for specific business needs, allowing for scalable usage from basic tracking to advanced analytics involving predictive modeling and data visualization techniques.
Employee performance KPI Excel template
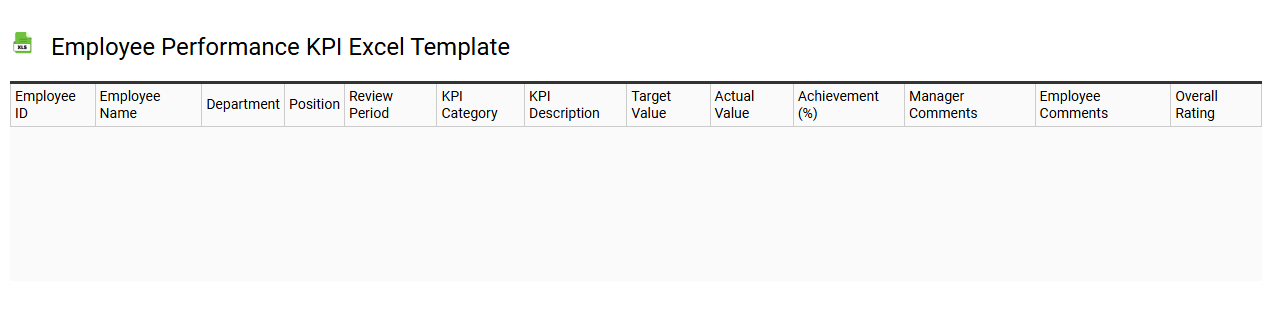
💾 Employee performance KPI Excel template template .xls
An Employee Performance KPI (Key Performance Indicator) Excel template is a structured tool designed to track and evaluate employee performance metrics over time. This template typically includes various performance indicators, such as productivity levels, quality of work, attendance, and goal achievement. By presenting data in an organized manner, it enables managers to assess individual and team contributions effectively. You can customize this template to suit your specific performance evaluation criteria and further explore advanced analytics like predictive performance modeling or competency mapping for deeper insights.
Financial KPI tracker Excel template
![]()
💾 Financial KPI tracker Excel template template .xls
A Financial KPI Tracker Excel template is a powerful tool designed to help you monitor and analyze key financial performance indicators in your business. This template typically includes pre-defined metrics such as revenue growth, profit margins, operating expenses, and cash flow, allowing for easy tracking over time. By utilizing charts and graphs within the template, visual representations of financial trends become readily accessible, facilitating informed decision-making. You can easily customize this template to address your specific financial goals, while also considering advanced analytics like predictive modeling or scenario analysis to optimize future planning.
Project management KPI Excel template
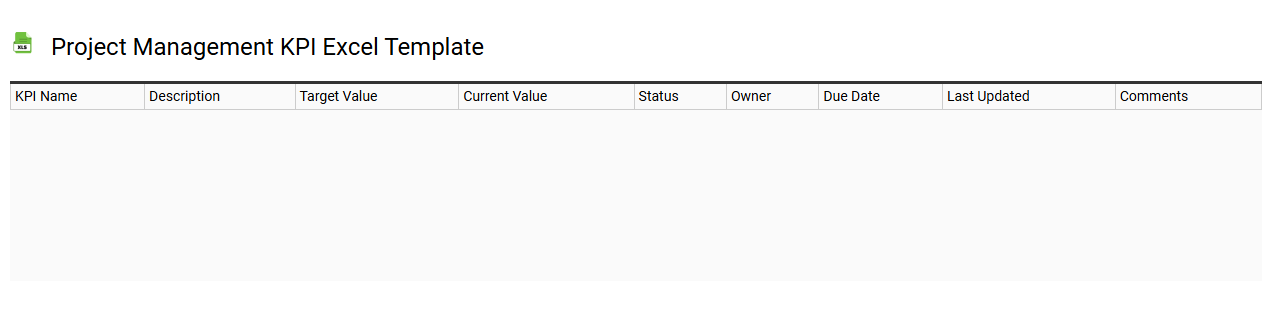
💾 Project management KPI Excel template template .xls
A Project Management KPI Excel template is a structured spreadsheet designed to track and measure key performance indicators (KPIs) essential for effective project oversight. This template allows you to input data such as project timelines, budget adherence, resource allocation, and stakeholder satisfaction metrics, providing a comprehensive overview of your project's health. You can easily visualize performance trends through built-in charts and graphs, enabling informed decision-making and timely adjustments. For foundational tracking or advanced analysis, such as forecasting using regression models, your needs can be met with this template's versatile features.
Marketing KPI report Excel template
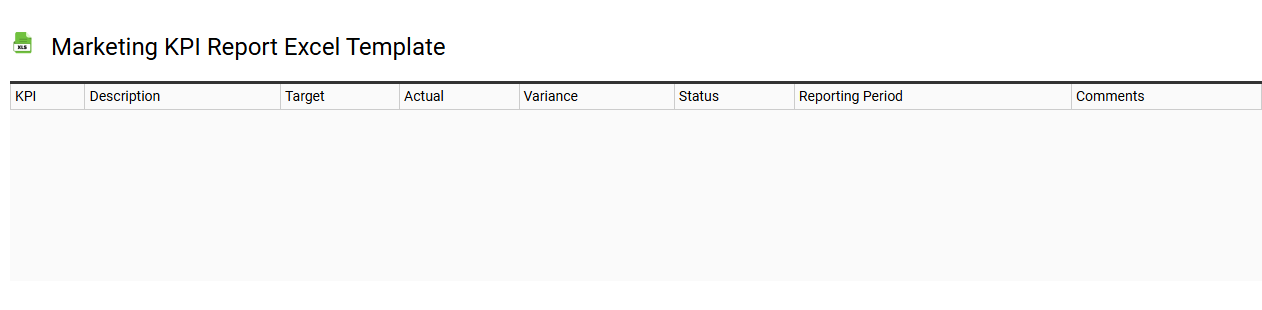
💾 Marketing KPI report Excel template template .xls
A Marketing KPI report Excel template is a versatile tool designed to track and analyze key performance indicators (KPIs) related to marketing campaigns and strategies. This template often includes sections to input data on metrics such as website traffic, conversion rates, customer acquisition cost, and return on investment. Color-coded graphs and charts visually represent trends and performance levels, making it easier for you to identify areas needing improvement. Using this template not only streamlines your reporting process but also allows for advanced analytics, such as predictive modeling and cohort analysis, to enhance future marketing efforts.
Business KPI scorecard Excel template
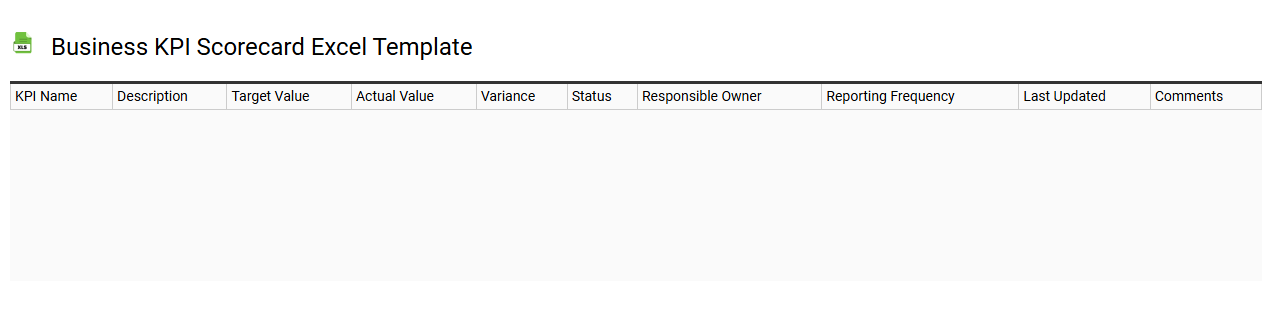
💾 Business KPI scorecard Excel template template .xls
A Business KPI scorecard Excel template provides a structured framework for tracking key performance indicators, enabling organizations to evaluate their performance effectively. This customizable tool allows you to input various metrics, such as sales growth, customer satisfaction, and operational efficiency, facilitating easy identification of trends and areas for improvement. With clear visual representations, such as graphs and charts, it simplifies data analysis, helping stakeholders make informed decisions. Beyond basic usage, this template can be enhanced by integrating advanced analytics, predictive modeling, or automated reporting capabilities for deeper insights into your business's health.
Customer service KPI Excel template
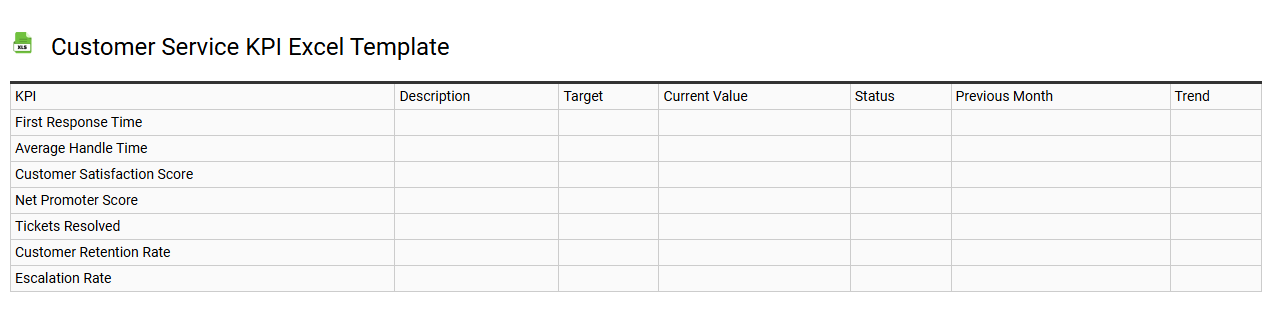
💾 Customer service KPI Excel template template .xls
A Customer Service KPI Excel template serves as a structured framework to track and analyze key performance indicators related to customer support operations. This template typically includes metrics like response time, resolution time, customer satisfaction scores, and ticket volumes. By utilizing this organized approach, you can effectively visualize trends, identify areas for improvement, and make data-driven decisions to enhance service quality. As you become familiar with basic usage, consider exploring more advanced features like automation, complex formulas, or integration with customer relationship management systems for deeper insights.
HR KPI report Excel template
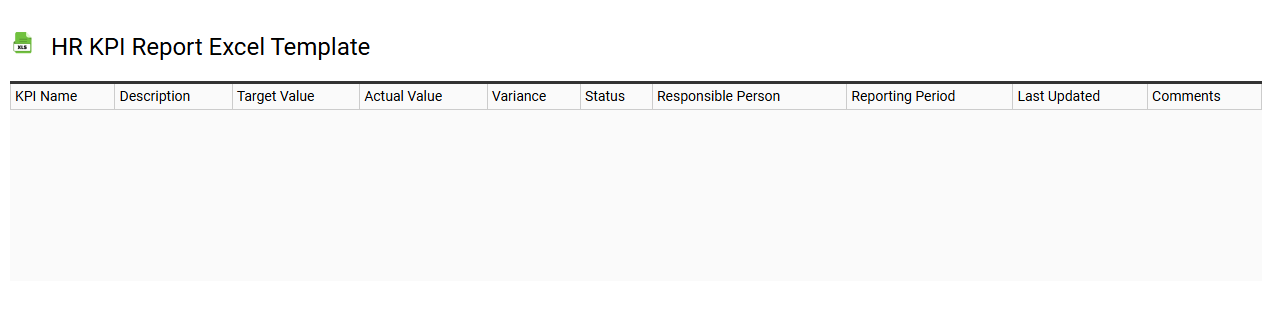
💾 HR KPI report Excel template template .xls
An HR KPI report Excel template is a structured tool designed to help human resources professionals track, analyze, and visualize key performance indicators related to workforce management. This template often includes metrics like employee turnover rates, recruitment efficiency, training effectiveness, and employee engagement scores. You can customize the layout to focus on specific insights that matter most to your organization, facilitating quick assessments and data-driven decision-making. Mastering this template can set the groundwork for advanced analytics, such as predictive modeling and workforce planning.
Operational KPI dashboard Excel template
💾 Operational KPI dashboard Excel template template .xls
An Operational KPI dashboard Excel template is a customizable spreadsheet designed to track and visualize key performance indicators (KPIs) essential for monitoring the efficiency and effectiveness of business operations. This template typically incorporates various charts and graphs, allowing you to present data in a visually engaging manner for easy analysis. It can include metrics such as production efficiency, customer satisfaction, and operational costs, enabling you to quickly identify trends and make informed decisions. Such a tool is useful not only for basic reporting but also for advanced analytics like predictive modeling and data forecasting, which can help optimize operational strategies.