Explore a collection of free XLS templates designed specifically for your yearly sales report needs. Each template features user-friendly layouts with clearly defined sections for revenue tracking, product performance, and overall trend analysis. You can easily customize these templates to align with your business goals, ensuring that your sales data is organized, easy to interpret, and visually appealing for stakeholders.
Yearly sales report Excel template with charts
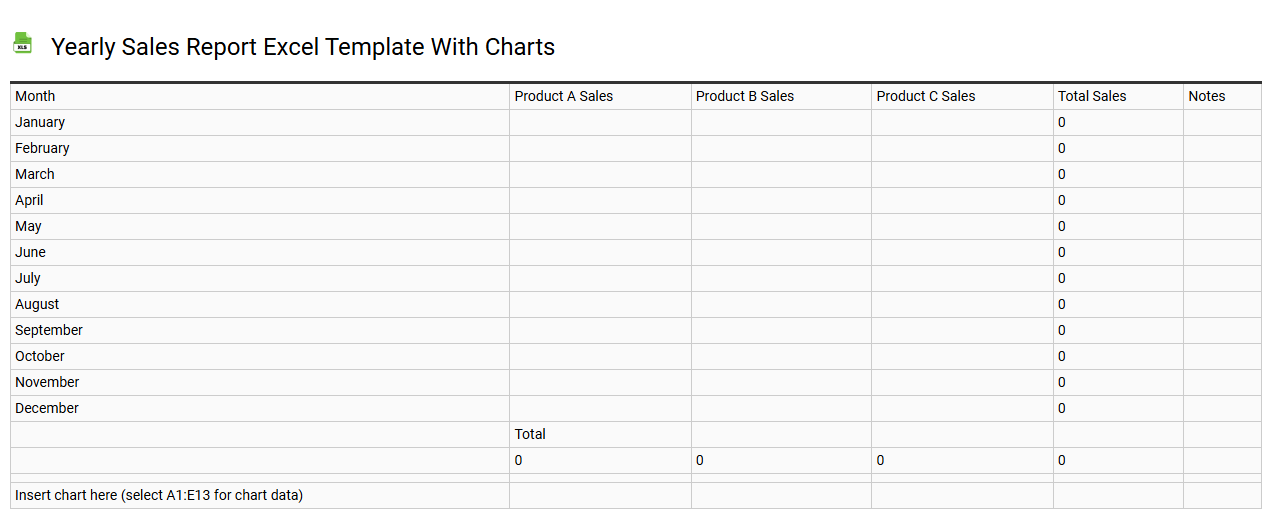
💾 Yearly sales report Excel template with charts template .xls
A yearly sales report Excel template with charts is a streamlined tool designed to help businesses analyze annual sales performance visually and succinctly. It typically includes sections for inputting data such as total sales, revenue sources, and profit margins, creating a clear overview of business trends. The integrated charts, including bar graphs and pie charts, enable you to visualize sales distributions and highlight key insights effectively. This template caters to basic needs while offering advanced features like dynamic data updates and predictive analytics for future sales forecasting.
Annual sales summary Excel template
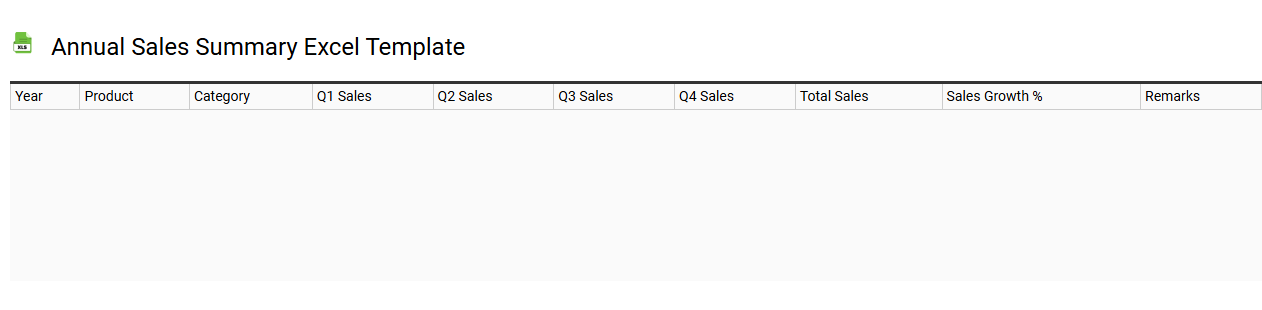
💾 Annual sales summary Excel template template .xls
An Annual Sales Summary Excel template is a structured tool designed to help businesses track and analyze their sales data over a 12-month period. It typically encompasses several key components, including total sales for each month, product or service categories, and performance metrics such as growth percentages and average sales per month. You can easily input your sales figures, allowing for straightforward visualizations through graphs or charts to identify trends and seasonal patterns. This template not only simplifies basic sales tracking but can also be customized for advanced analytics, such as forecasting, KPI monitoring, and detailed sales performance assessments.
Yearly sales report Excel template for small business
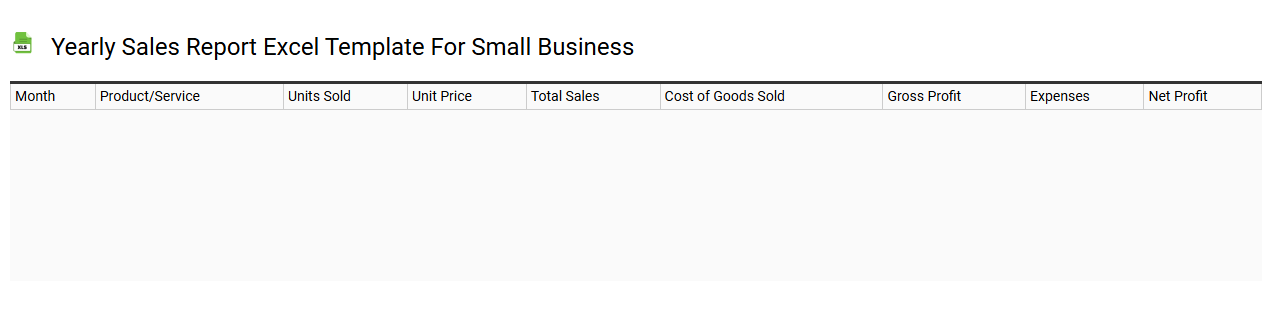
💾 Yearly sales report Excel template for small business template .xls
A yearly sales report Excel template for small businesses serves as a structured tool to track and analyze annual sales data comprehensively. It typically includes sections for recording monthly sales figures, customer details, product categories, and seasonal trends, making it easy to identify performance patterns. You can utilize visual elements like graphs and charts to present data in an easily digestible format, facilitating better business decisions. This template can help in basic sales tracking and has the potential to evolve into more complex analyses, such as forecasting and customer segmentation.
Yearly sales performance Excel template
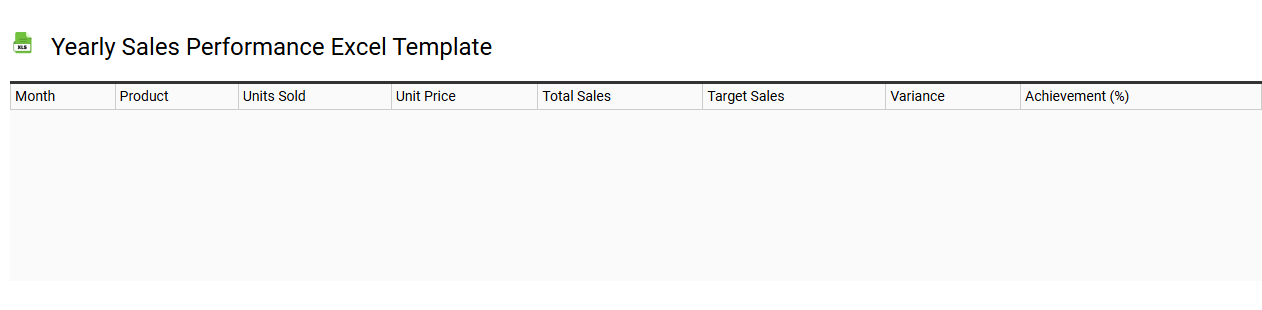
💾 Yearly sales performance Excel template template .xls
A Yearly Sales Performance Excel template is a structured spreadsheet designed to help businesses track and analyze their sales data over a 12-month period. This template typically includes sections for inputting data such as monthly sales figures, product categories, and sales representatives, allowing for comprehensive performance reviews. Visual aids like graphs and charts enhance data interpretation, making it easy to identify trends and areas for improvement. For your business's growth, this tool offers basic functionality for tracking progress and can be expanded with advanced analytics features like forecasting models and pivot tables to better understand consumer behavior and streamline decision-making.
Sales analysis Excel template yearly report
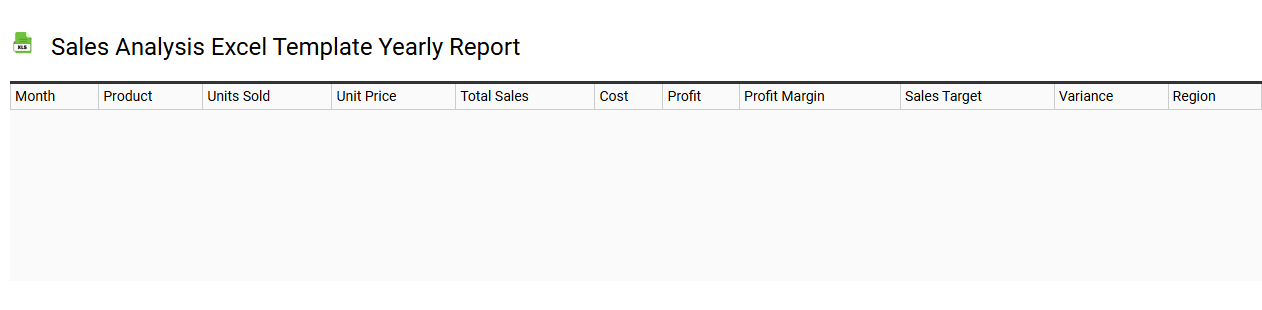
💾 Sales analysis Excel template yearly report template .xls
A Sales Analysis Excel template for a yearly report organizes and visualizes sales data over the course of a year. It typically includes sections for revenue breakdown by product, sales performance by region, and comparative analysis with previous years' data. Graphs and charts highlight trends, helping you identify peak sales periods and underperforming areas. This structured approach not only aids in understanding past performance but also equips you for forecasting future sales strategies, facilitating advanced analytics like predictive modeling and sales trend analysis.
Yearly sales revenue Excel template
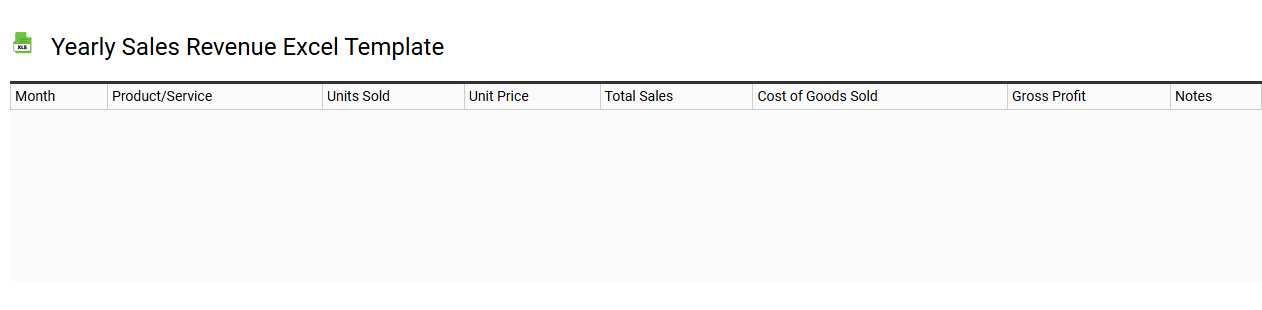
💾 Yearly sales revenue Excel template template .xls
The Yearly Sales Revenue Excel template is a structured tool designed to track and analyze your sales performance over a 12-month period. This template typically includes customizable fields for inputting data such as sales figures, product categories, and monthly targets, allowing you to easily visualize revenue trends and seasonality. Graphical representations, like charts and graphs, can help you compare actual sales against forecasts, fostering insights into your business's performance. Beyond basic tracking, this template can also cater to advanced needs by incorporating complex formulas, pivot tables, and forecasting algorithms to optimize your strategic planning.
Yearly product sales report Excel template
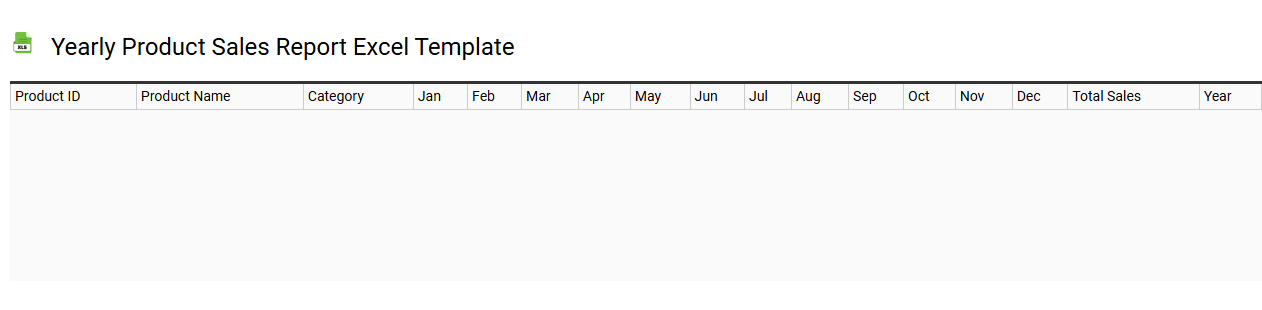
💾 Yearly product sales report Excel template template .xls
A Yearly Product Sales Report Excel template is a structured spreadsheet designed to compile and analyze a company's sales data over the course of a year. This template typically includes sections for product names, categories, sales figures, profit margins, and growth trends, allowing you to track performance efficiently. Visualization tools such as charts and graphs are often integrated to present the data in an easily digestible format. You can use this template for basic sales tracking, or expand its functionality to include predictive analytics and complex forecasting models.
Yearly sales tracking Excel template
![]()
💾 Yearly sales tracking Excel template template .xls
A Yearly Sales Tracking Excel template is a structured spreadsheet designed to help businesses monitor and analyze their sales performance over a 12-month period. This template typically includes sections to input monthly sales figures, categorize sales by product or service, and generate visual charts for quick analysis. Users can easily track trends, identify peak sales periods, and evaluate progress against sales targets through this visual representation of data. For those seeking more advanced features, integration with sales forecasting tools and real-time data analytics could enhance your tracking capabilities.
Yearly sales dashboard Excel template
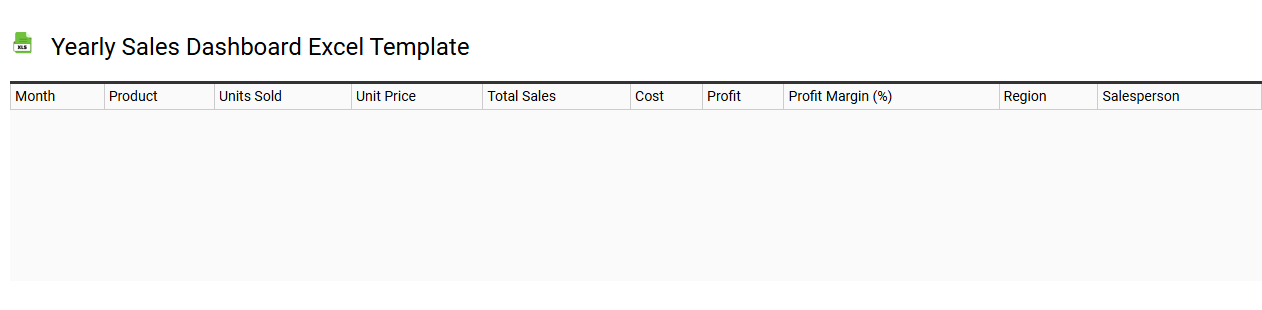
💾 Yearly sales dashboard Excel template template .xls
A Yearly Sales Dashboard Excel template provides a visual representation of sales performance over a year. It typically includes key metrics such as total sales revenue, monthly comparisons, and performance against targets. The template may feature graphs, charts, and tables that allow you to quickly analyze trends and identify areas needing improvement. For basic usage, you can track overall progress, while further potential needs could involve advanced forecasting models and integration with real-time data analytics.
Yearly sales comparison Excel template
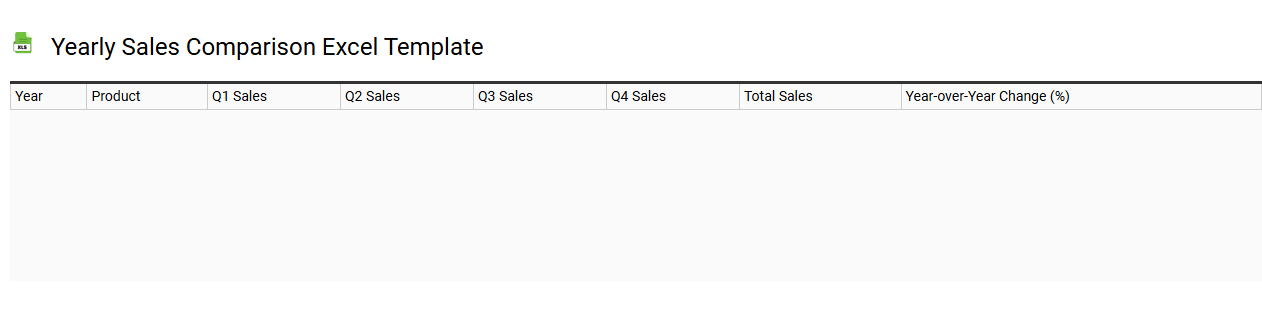
💾 Yearly sales comparison Excel template template .xls
A Yearly Sales Comparison Excel template is a pre-designed spreadsheet that enables users to analyze and compare sales performance over multiple years. It typically includes columns for different years, sales figures, percentage growth, and visual graphs for better interpretation of data trends. This tool streamlines tracking your sales progress, helping identify patterns and seasonal fluctuations. You can modify it further to include advanced metrics like market share analysis or sales forecasting techniques tailored to your business needs.