Discover a range of free XLS templates designed specifically for Break-Even Analysis. These templates allow you to input your fixed and variable costs, helping you calculate the break-even point with ease. Each template features user-friendly layouts, charts to visualize data, and customizable fields to fit your unique business needs.
Break even analysis Excel template for small business
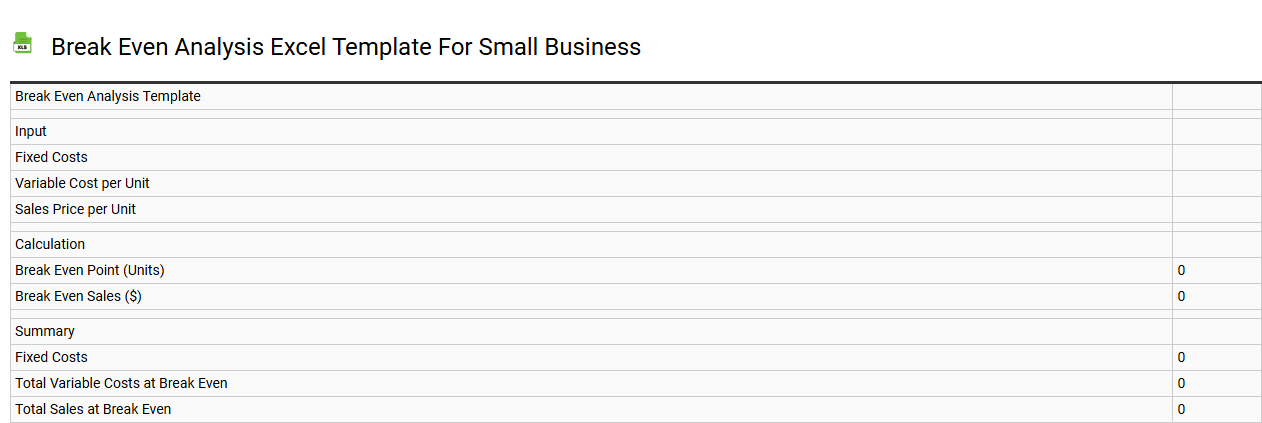
💾 Break even analysis Excel template for small business template .xls
A Break Even Analysis Excel template is a valuable tool for small businesses, providing a clear visual representation of when a company will become profitable. This template displays fixed and variable costs, allowing you to calculate the break-even point--the moment when total revenues equal total costs. You can easily adjust input variables such as sales price, units sold, and cost structure, offering flexible scenarios for strategic decision-making. Mastering this tool not only aids in financial planning but also supports advanced analyses like sensitivity analysis and margin of safety calculations.
Restaurant break even analysis Excel template
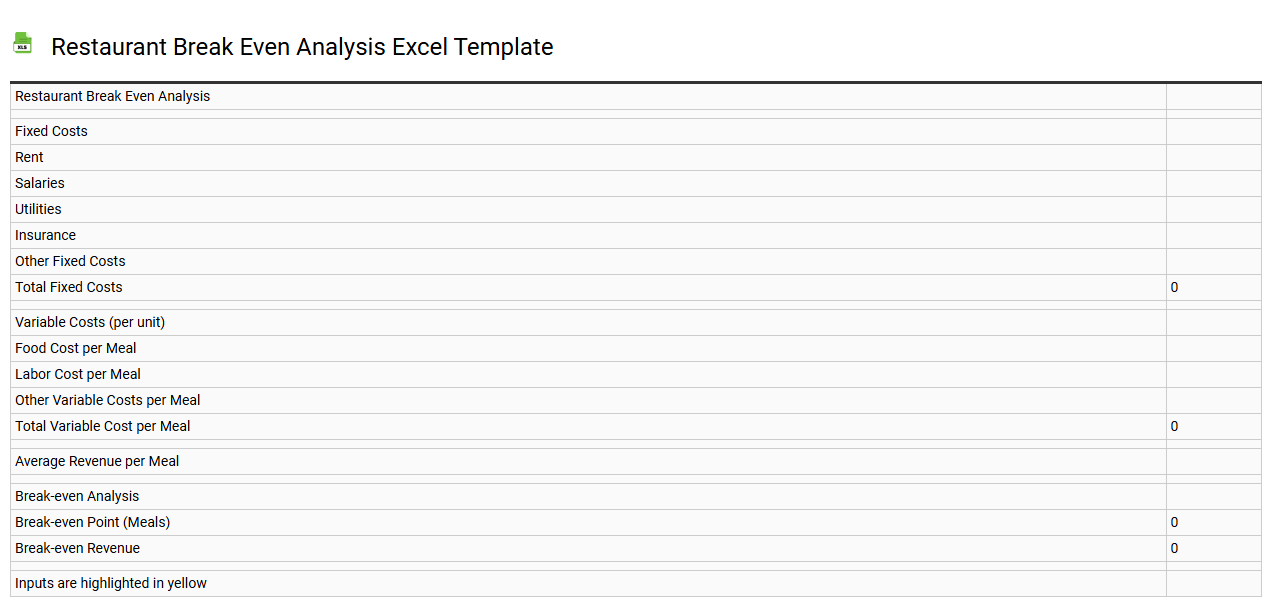
💾 Restaurant break even analysis Excel template template .xls
A Restaurant Break Even Analysis Excel template is a powerful tool designed to help restaurant owners and managers calculate the point at which total revenues equal total costs. This template typically includes sections for fixed costs, variable costs per unit, and the selling price per menu item, allowing for straightforward input and calculation. By using this template, you can easily visualize how many meals or units must be sold to cover expenses, aiding in strategic decision-making. Beyond basic usage, this template can be adapted for advanced financial modeling, such as scenario analysis or profit margin projections, to enhance your restaurant's financial planning.
Manufacturing break even analysis Excel template
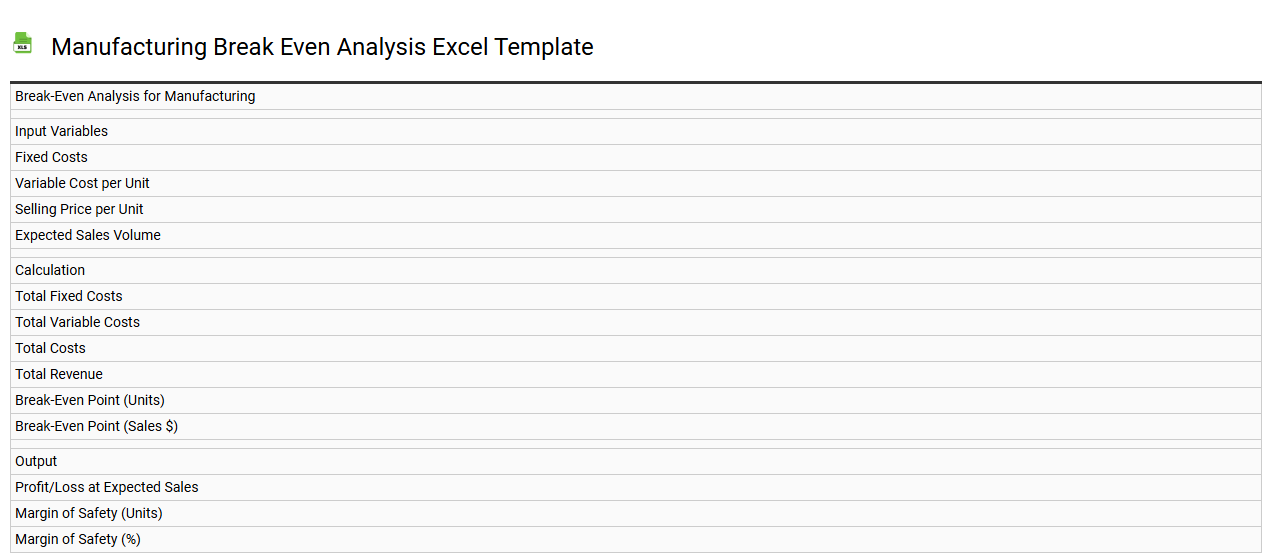
💾 Manufacturing break even analysis Excel template template .xls
A Manufacturing Break Even Analysis Excel template is a dynamic spreadsheet designed to help businesses determine the point at which total revenues equal total costs, leading to neither profit nor loss. This template typically includes sections for fixed costs, variable costs per unit, and sales price per unit, allowing users to easily input their specific financial data. Visual charts often accompany the numerical data, illustrating the break-even point and the impact of varying production levels on profitability. You can utilize this tool for basic calculations, while further potential needs may include advanced forecasting models, sensitivity analysis, and scenario planning to enhance decision-making capabilities.
Simple break even analysis Excel template free download
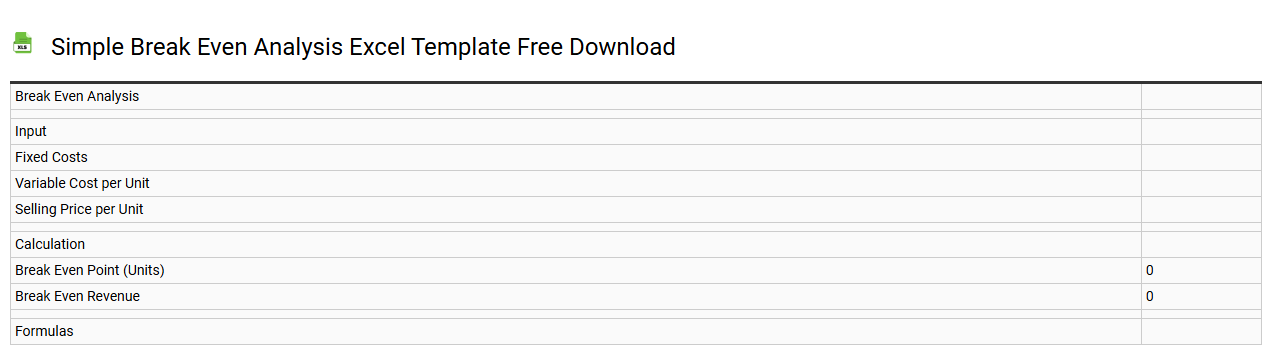
💾 Simple break even analysis Excel template free download template .xls
A Simple Break Even Analysis Excel template is a user-friendly spreadsheet designed to help you determine the break-even point for your business. This tool allows you to input fixed costs, variable costs, and pricing information, calculating the number of units you need to sell to cover your expenses. Visual graphs and tables enable you to easily interpret your data, helping you make informed financial decisions. For basic usage, you can track essential figures, while advanced needs might include incorporating sensitivity analysis or forecasting future sales scenarios.
Break even analysis Excel template with charts
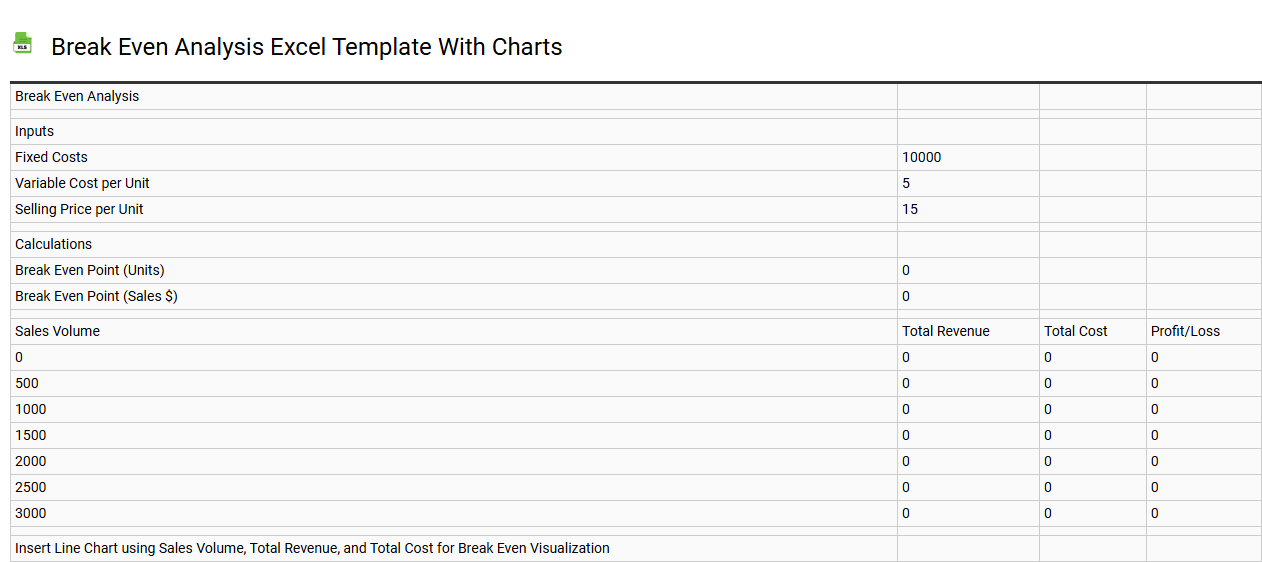
💾 Break even analysis Excel template with charts template .xls
A Break-even analysis Excel template with charts visually represents the point at which total revenues equal total costs, indicating no profit or loss. This tool typically includes sections for fixed and variable costs, sales price per unit, and forecasted sales volume, allowing for a comprehensive overview of financial dynamics. Charts such as line graphs illustrate the break-even point, highlighting how changes in sales volume and costs impact profitability. You can utilize this template for basic financial assessments while considering more advanced needs, like scenario analysis or sensitivity studies, to explore various business outcomes.
Break even analysis Excel template for startups
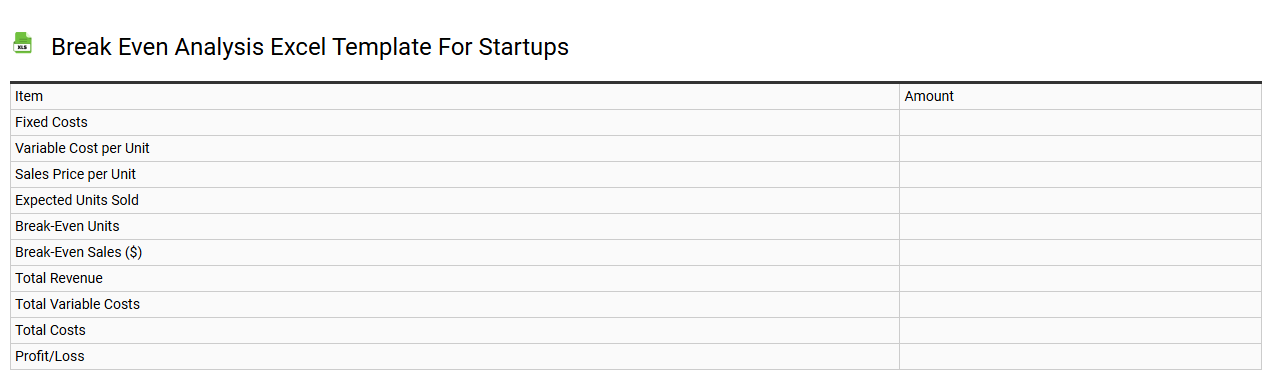
💾 Break even analysis Excel template for startups template .xls
A break-even analysis Excel template is a structured tool designed to help startups assess the point at which their total revenues equal total costs, resulting in neither profit nor loss. The template typically includes inputs for fixed costs, variable costs per unit, and selling price per unit, providing a clear overview of how many units need to be sold to break even. Advanced features might incorporate graphs for visual representation and dynamic calculations that adjust as you modify input values. You can leverage this template not only for immediate assessments but also for future financial modeling, considering more complex terms such as contribution margin and sensitivity analysis.
Retail break even analysis Excel template
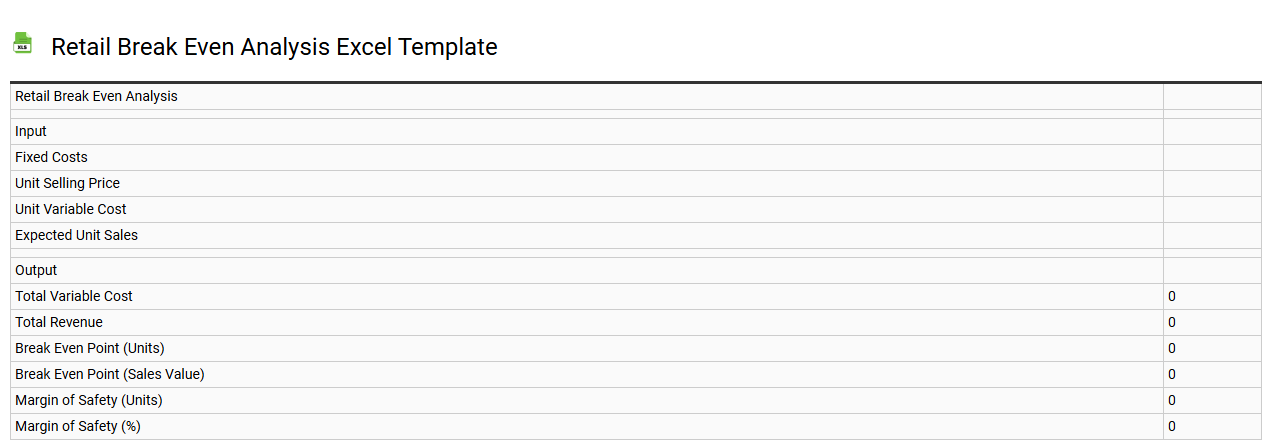
💾 Retail break even analysis Excel template template .xls
A retail break-even analysis Excel template allows you to determine the point at which your total revenues equal total costs, meaning you neither make a profit nor incur a loss. This tool typically includes sections for fixed costs, variable costs per unit, and selling price per unit, providing a clear visual representation of how changes in these variables impact profitability. Utilizing charts and graphs, the template helps you identify the break-even point and project future financial scenarios based on different sales volumes. You might need this analysis for basic budgeting, but it can also facilitate advanced financial forecasting techniques like sensitivity analysis or margin of safety calculations.
Hotel break even analysis Excel template
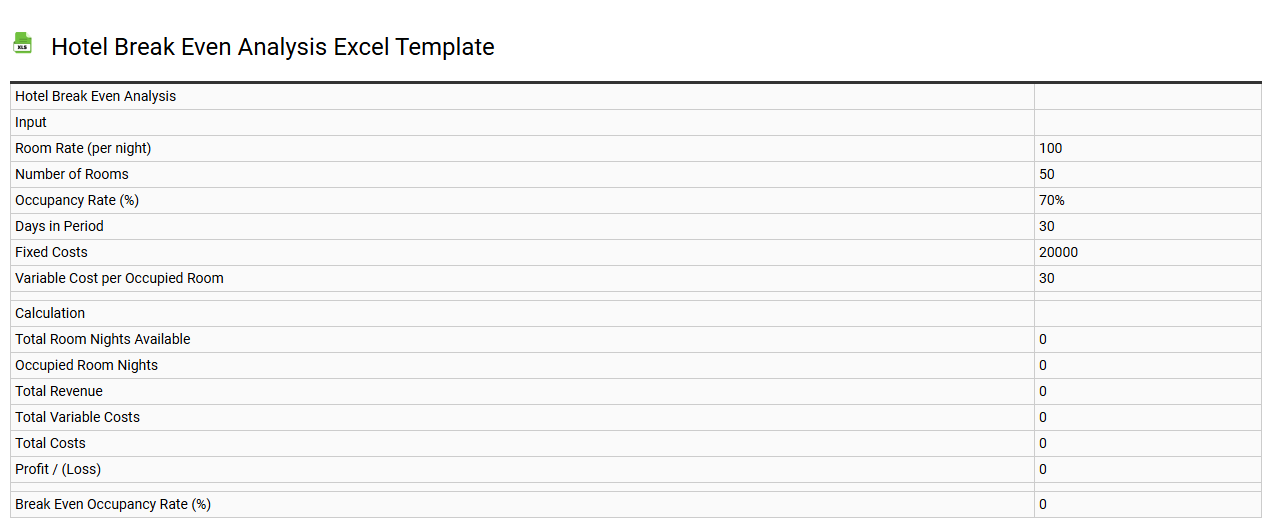
💾 Hotel break even analysis Excel template template .xls
A Hotel break-even analysis Excel template is a tool designed to help hotel owners and managers determine the point at which their total revenue equals total costs, indicating neither profit nor loss. This template typically includes categories for fixed costs, variable costs, occupancy rates, room pricing, and revenue projections. You can visualize various scenarios by adjusting different parameters, providing insights into operational efficiency and profitability. Utilizing this template not only aids in understanding the current financial standing but also assists in forecasting future financial performance and strategic decision-making, including pricing strategies and marketing efforts.
Break even analysis Excel template with fixed and variable costs
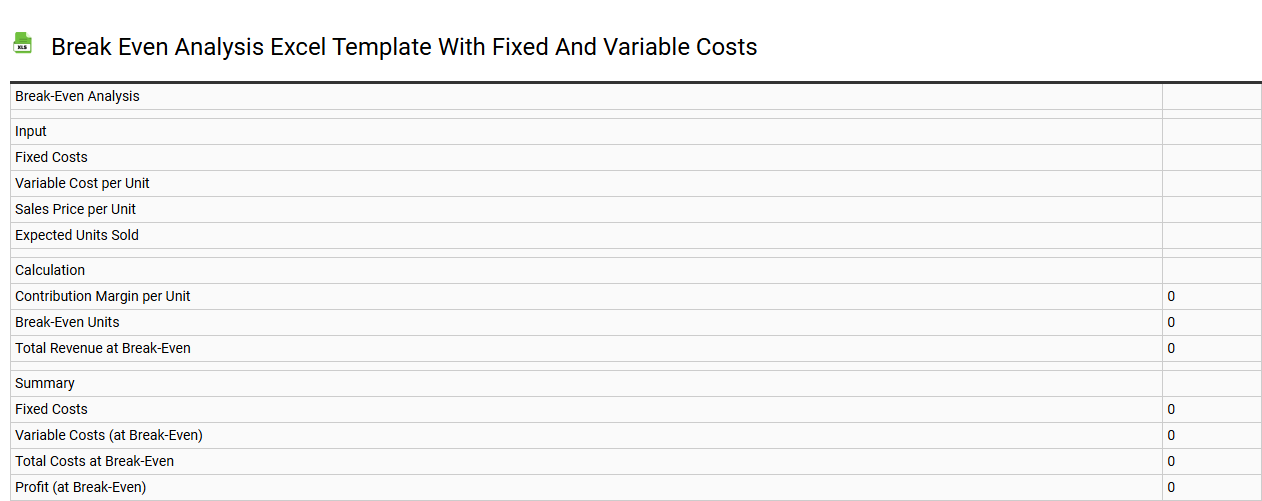
💾 Break even analysis Excel template with fixed and variable costs template .xls
A Break Even Analysis Excel template provides a structured way to evaluate the financial viability of a business by pinpointing the sales volume at which total revenues equal total costs. It clearly separates fixed costs, which remain constant irrespective of production levels, from variable costs, which fluctuate with output. This template visually presents data through charts and tables, allowing you to assess profitability and make informed decisions. This basic analysis can serve as a foundation for more complex financial modeling, such as sensitivity analysis or forecasting future cash flows.
Break even analysis Excel template for service business
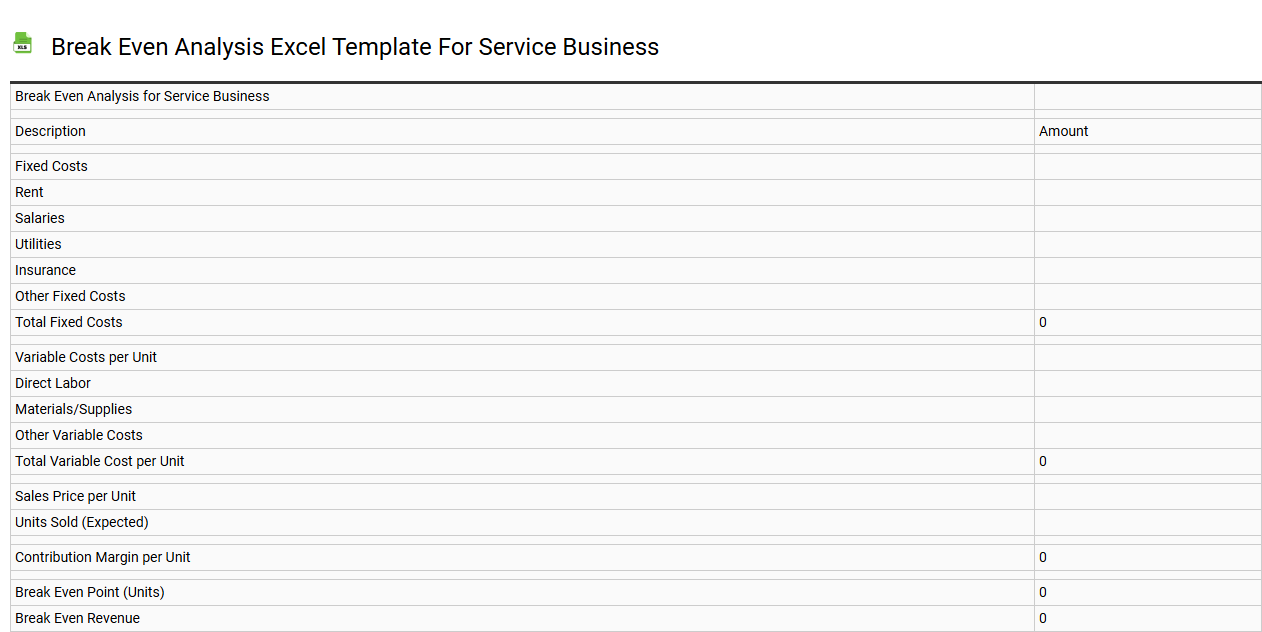
💾 Break even analysis Excel template for service business template .xls
A Break-even analysis Excel template for a service business is a structured spreadsheet tool designed to help you determine the point at which your total revenues equate to your total expenses. This template typically features sections for fixed costs, variable costs, and projected sales revenue, enabling you to visualize when your service offering will become profitable. By entering your specific financial data, you can easily adjust variables like pricing and service volume to understand their impact on profitability. Such templates can also support advanced calculations, including margin of safety and required sales to achieve desired profit levels, facilitating strategic planning and performance enhancement.