Explore a wide array of free XLS templates for financial analysis that cater to different needs, such as budgeting, forecasting, and expense tracking. Each template features user-friendly layouts, allowing for easy input and real-time updates on your financial data. Optimize your financial decision-making with customizable charts and tables that provide a clear visual representation of your financial health.
Financial statement analysis Excel template
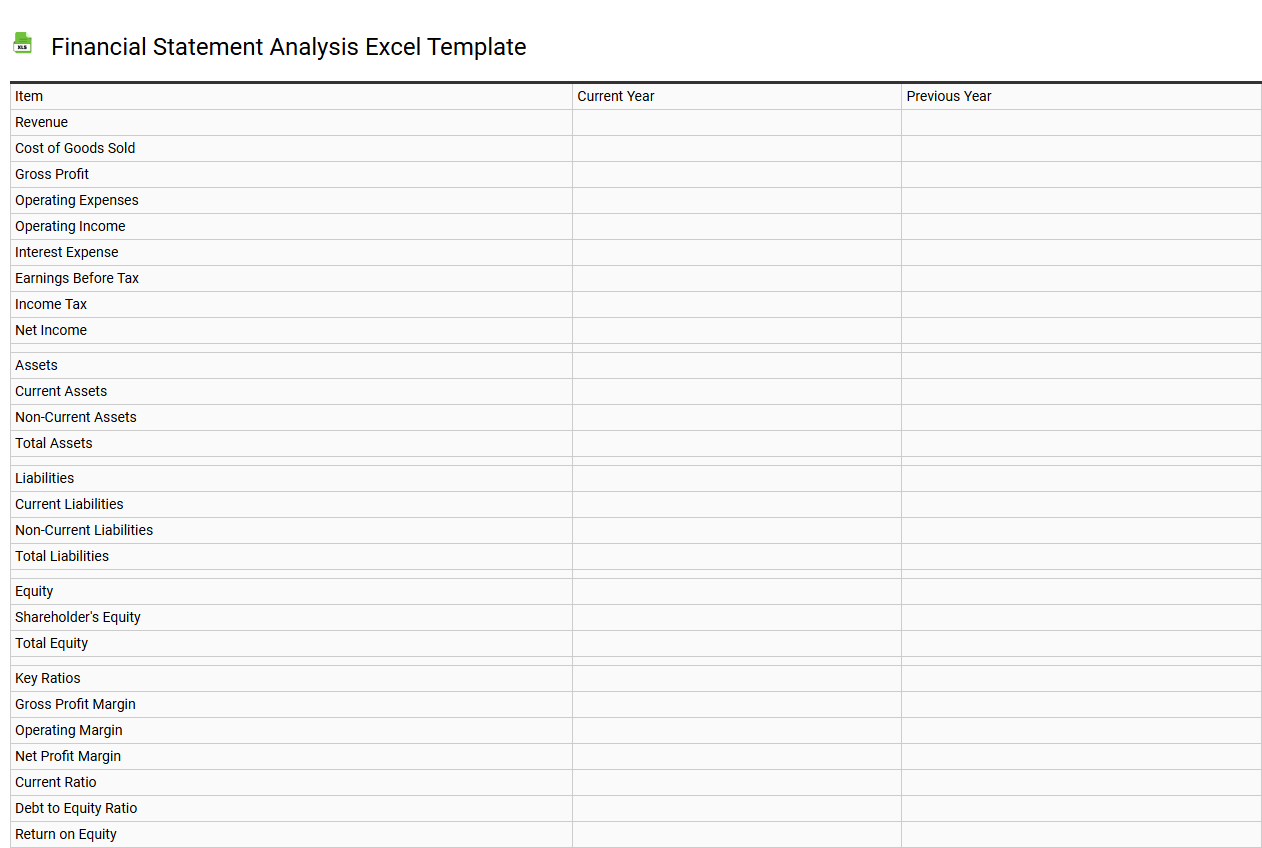
💾 Financial statement analysis Excel template template .xls
A Financial Statement Analysis Excel template is a structured tool designed to help you assess the financial health of a business by reviewing its income statement, balance sheet, and cash flow statement. This template typically includes pre-built formulas and sections for key metrics such as liquidity ratios, profitability ratios, and solvency ratios, enabling users to efficiently evaluate performance trends over time. Visual aids like charts and graphs are often incorporated to enhance understanding and facilitate quick insights into financial data. Using this template streamlines the evaluation process, allowing for easy adjustments and further potential needs like forecasting, scenario analysis, and comprehensive financial modeling.
Cash flow analysis Excel template
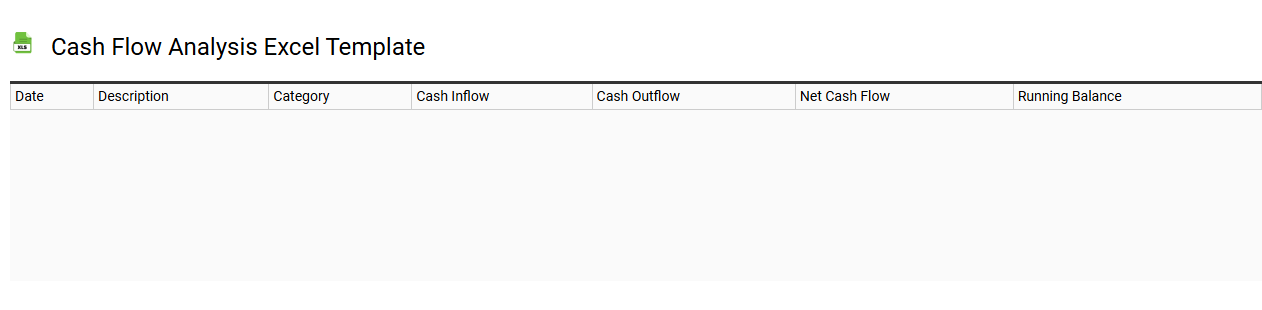
💾 Cash flow analysis Excel template template .xls
A Cash Flow Analysis Excel template is a pre-designed spreadsheet that assists you in tracking and managing the inflows and outflows of cash within your business over a specific period. This template features organized sections for detailing various income sources, such as sales revenue and investment income, alongside expenses like operating costs and loan payments. Formulas are typically embedded to automatically calculate the net cash flow, providing you with an instant overview of your financial position. Such a tool can be essential for basic budget management and forecasting, while more complex needs may require customization with advanced financial modeling techniques such as scenario analysis or sensitivity analysis.
Ratio analysis Excel template
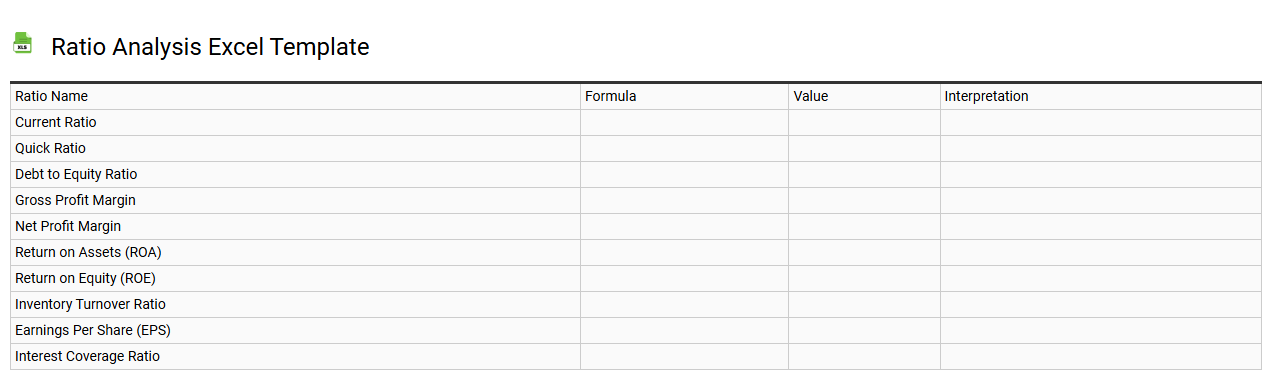
💾 Ratio analysis Excel template template .xls
A Ratio Analysis Excel template is a powerful tool designed to help individuals and businesses assess financial performance by calculating key financial ratios. This template typically includes sections for inputting financial data, such as income statements and balance sheets, allowing for automated calculations of ratios like liquidity, profitability, and solvency. Visual elements such as charts and graphs enhance understanding of trends and comparisons over time. You can use this template for basic evaluations of financial health, while further customization may serve more complex analyses, integrating advanced metrics like Economic Value Added (EVA) or DuPont Analysis.
Budget vs actual analysis Excel template
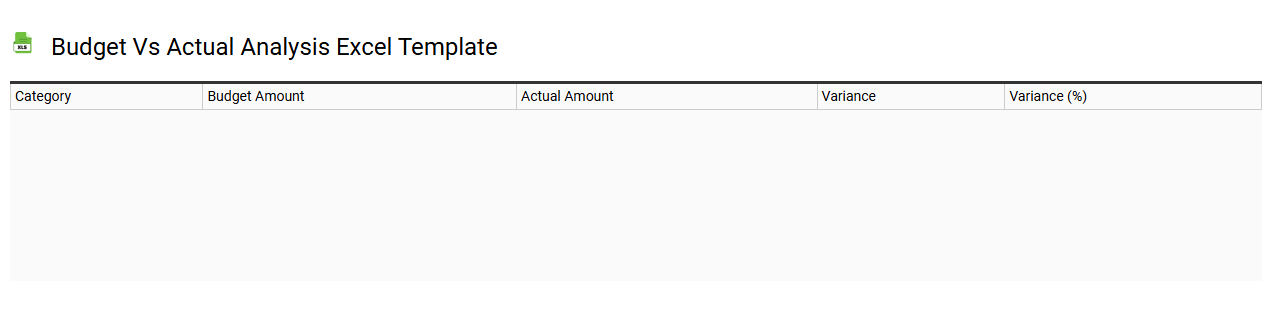
💾 Budget vs actual analysis Excel template template .xls
A Budget vs Actual Analysis Excel template serves as a powerful tool for financial management, allowing you to compare your projected budget against actual expenditures and revenues. It typically includes categories such as income, fixed costs, variable costs, and discretionary spending, enabling a clear visualization of financial performance. You can easily identify discrepancies, pinpoint areas where you overspend or underspend, and adjust future budgets accordingly. This analytical tool can fulfill basic budgeting needs while also catering to advanced financial modeling, variance analysis, and forecasting requirements.
Profit and loss analysis Excel template
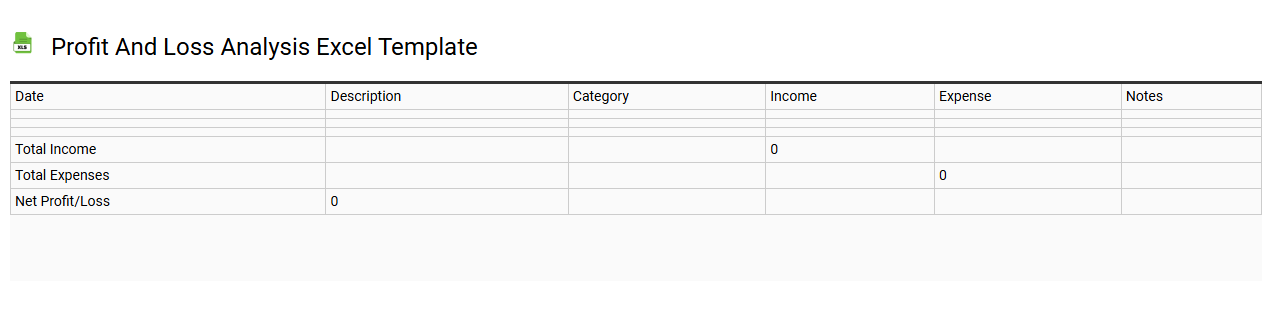
💾 Profit and loss analysis Excel template template .xls
A Profit and Loss Analysis Excel template is a structured tool designed to help individuals and businesses assess their financial performance over a specific period. It typically includes sections for recording revenues, costs, and expenses, allowing you to visualize profit margins clearly. This template helps identify trends, uncover potential inefficiencies, and make informed decisions regarding budgeting and investment strategies. By utilizing such a template, you can easily transition to more advanced financial analyses, like cash flow forecasting and scenario modeling, as your needs evolve.
Break-even analysis Excel template
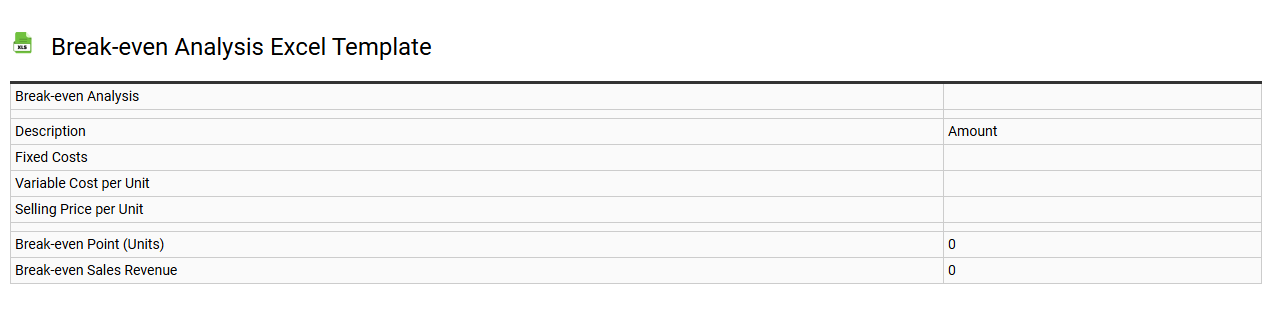
💾 Break-even analysis Excel template template .xls
A Break-even analysis Excel template is a structured spreadsheet designed to calculate the break-even point for a business or project. It allows you to input fixed and variable costs, along with projected sales revenue, to determine the volume of sales needed to cover total costs. You can visualize the relationship between costs, revenues, and profit through charts created within the template, making it easier to assess financial performance. Understanding your break-even point is essential for budgeting and financial planning, providing clarity on whether your business will be sustainable as you explore advanced concepts like contribution margin and sensitivity analysis.
Investment analysis Excel template
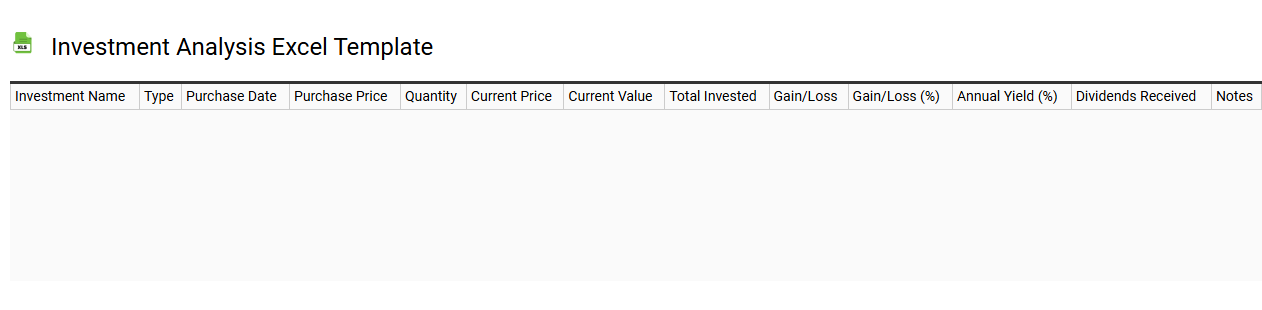
💾 Investment analysis Excel template template .xls
An Investment Analysis Excel template serves as a structured framework to evaluate potential investment opportunities. This template typically includes sections for inputting key data such as initial costs, expected cash flows, return rates, and timeframes. Users can project financial scenarios using formulas that facilitate quick calculations of metrics like Net Present Value (NPV) and Internal Rate of Return (IRR). Utilizing this template can streamline your investment decision-making process while providing insights into more complex evaluations, including sensitivity analysis and scenario planning.
Sales analysis Excel template
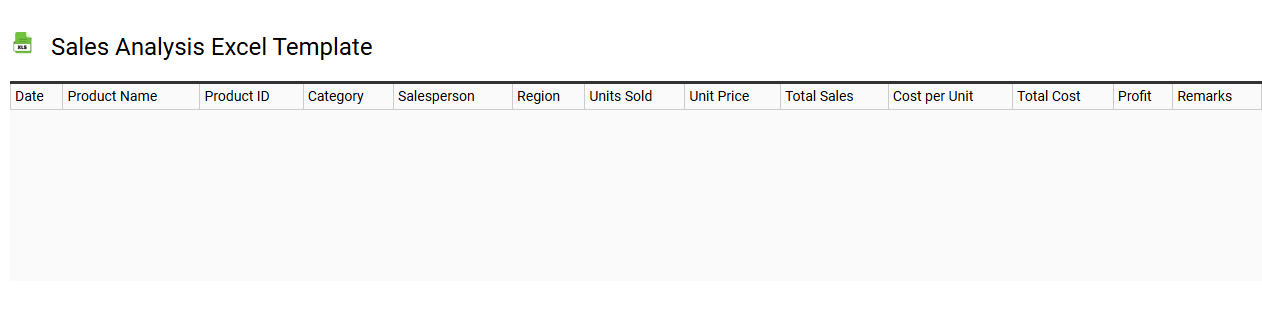
💾 Sales analysis Excel template template .xls
A Sales analysis Excel template is a pre-designed spreadsheet that helps you track, assess, and visualize your sales performance over time. It typically includes data entry fields for sales figures, product details, customer information, and time periods, allowing for organized input and easy updates. You can use charts and graphs within the template to identify sales trends, peak performance periods, and areas needing improvement. This tool not only streamlines your basic sales tracking, but also has potential for more advanced analytics, such as forecasting, KPI monitoring, and segmentation analysis.
Expense analysis Excel template
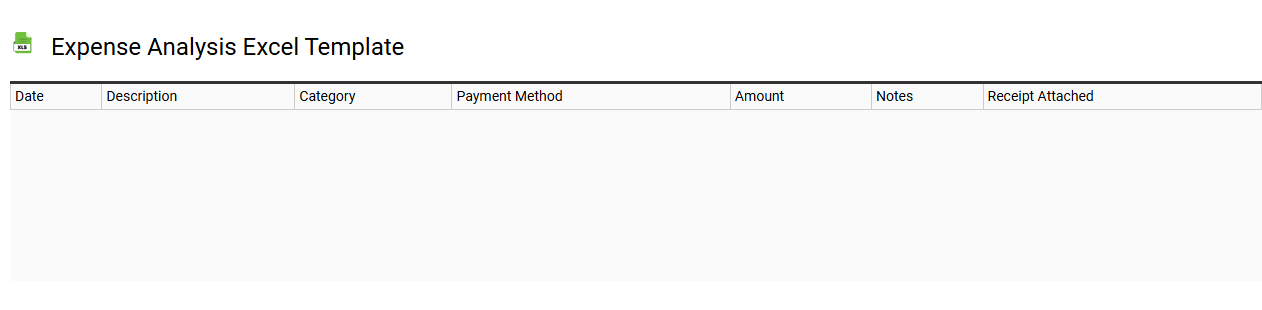
💾 Expense analysis Excel template template .xls
An Expense Analysis Excel template is a structured spreadsheet designed to help you track, categorize, and analyze your spending over a specific period. It typically includes various columns for date, amount, category, and details about each expense, allowing you to easily sort and filter your data. By visualizing your expenditures through charts and graphs, you gain insights into your spending habits, enabling informed financial decisions. The basic usage can evolve to include advanced forecasting tools or budget planning capabilities, providing a comprehensive overview of your financial health.
Monthly financial analysis Excel template
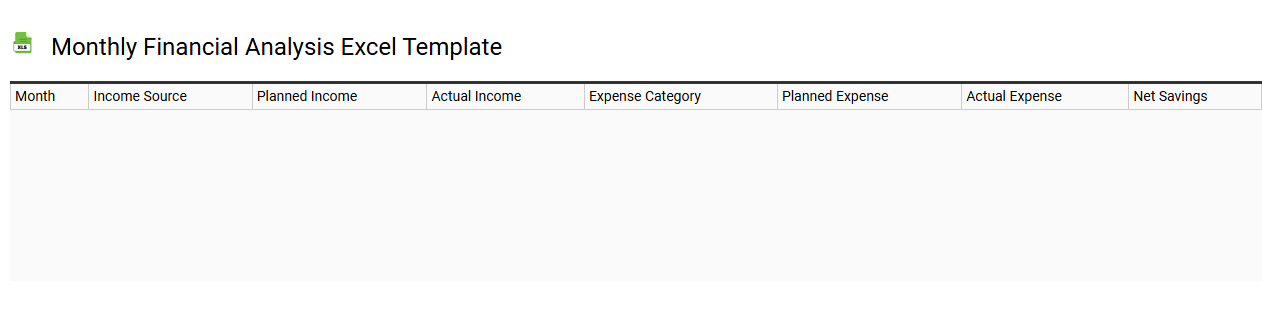
💾 Monthly financial analysis Excel template template .xls
A Monthly Financial Analysis Excel template is a structured tool designed to help you track and evaluate financial performance over each month. This template typically includes sections for income, expenses, profit margins, and cash flow, allowing for quick visual assessments through charts and tables. You can customize it to fit various financial goals, making it easier to identify trends, variances, and areas for improvement in your financial practices. Mastering this template can lead to advanced financial forecasting, budgeting, and strategic planning within your organization.