Explore a diverse range of free Excel templates specifically designed for sales analysis. These templates typically feature clear charts and graphs for visual data interpretation, making it easier to track sales trends and performance metrics. With customizable fields, you can tailor each template to fit your business needs, allowing you to gain deeper insights into your sales strategies.
Sales analysis dashboard Excel template
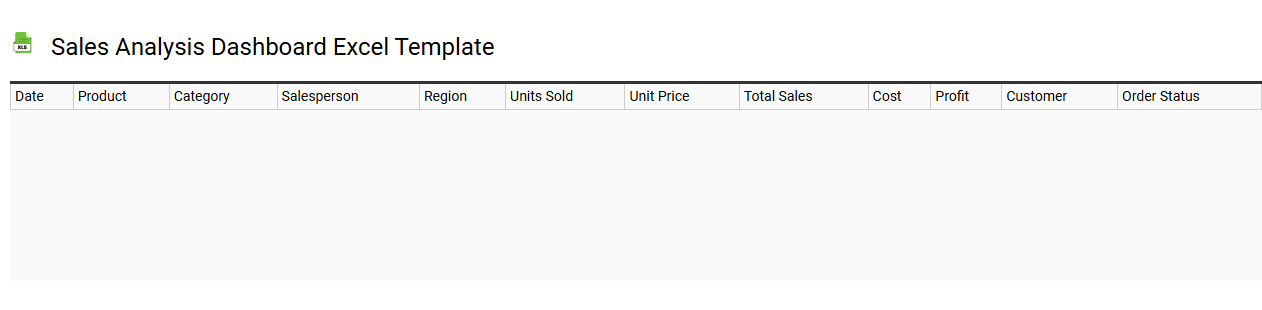
💾 Sales analysis dashboard Excel template template .xls
A Sales analysis dashboard Excel template is a structured tool designed to visualize and analyze sales performance metrics effectively. It typically includes key performance indicators (KPIs), such as total sales, revenue growth, market trends, and customer segmentation, all presented through graphs and charts for easy interpretation. You can customize this dashboard to track specific sales targets, regional performance, and product performance, ensuring that it aligns with your business objectives. Beyond basic usage for monitoring sales activities, it can be expanded with advanced features like predictive analytics and scenario modeling to drive strategic decision-making.
Monthly sales analysis Excel template
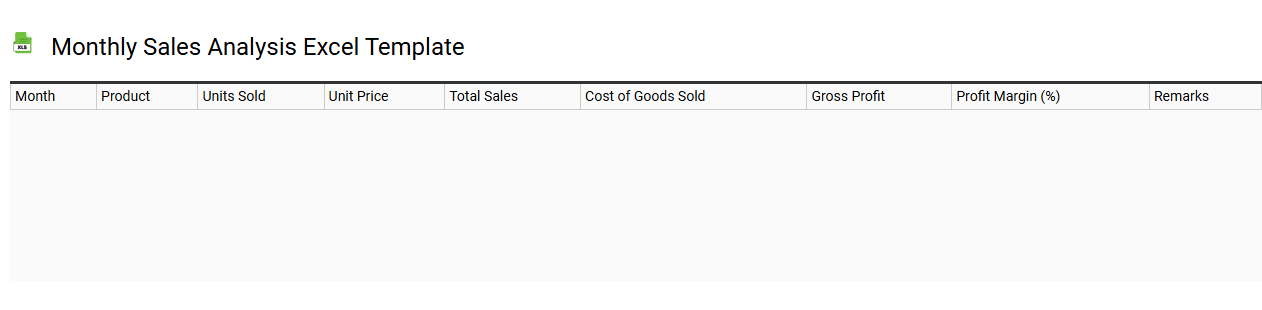
💾 Monthly sales analysis Excel template template .xls
A Monthly Sales Analysis Excel template is a structured spreadsheet designed to help businesses track and evaluate their sales performance over a specified month. It typically includes various sections such as sales totals, product categories, sales channels, and individual sales representative performance, providing a comprehensive view of sales activity. By utilizing this template, you can quickly identify trends, assess high-performing products, and make data-driven decisions aimed at improving sales strategies. This basic usage can be expanded to incorporate advanced analytics like forecasting techniques, regression analysis, or trend line forecasting for more in-depth insights.
Product sales analysis Excel template
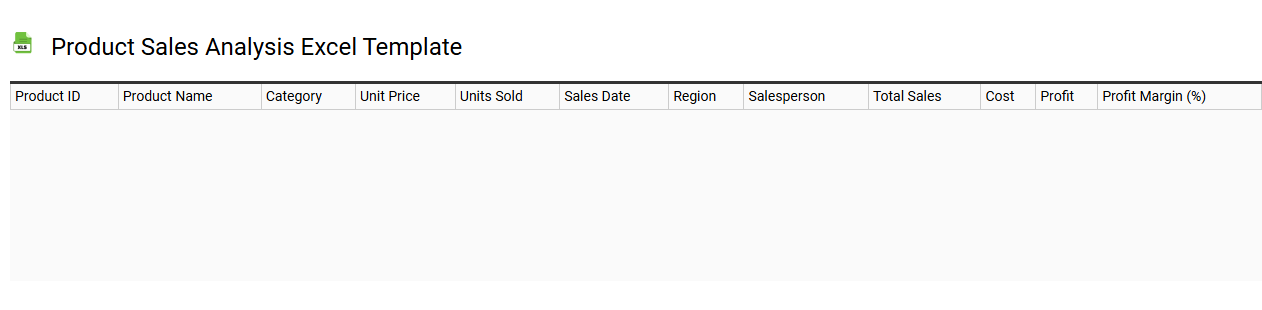
💾 Product sales analysis Excel template template .xls
A Product Sales Analysis Excel template serves as a structured tool for evaluating sales performance across various products. It typically includes organized sections for recording sales figures, tracking inventory levels, and analyzing pricing strategies, providing a comprehensive overview of product profitability. The template might feature graphical representations, such as charts and graphs, to visualize trends and facilitate data-driven decision-making. You can use this template not only to analyze current sales performance but also to uncover further potential needs in inventory management, forecasting, and even customer segmentation through advanced analytics.
Yearly sales analysis Excel template
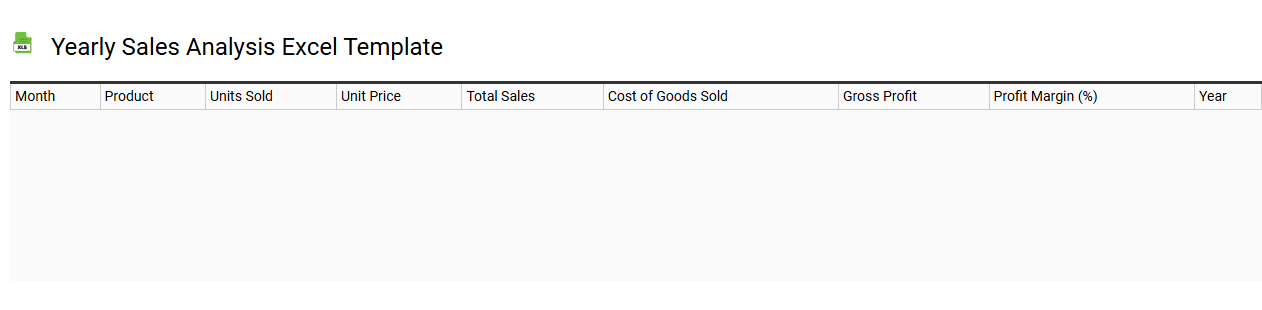
💾 Yearly sales analysis Excel template template .xls
A Yearly Sales Analysis Excel template is a structured tool designed to help businesses track and evaluate their sales performance over a calendar year. This template typically includes various components such as monthly sales figures, product categories, and relevant metrics like growth rates and trends. You can visualize your data with charts and graphs for a more intuitive understanding of sales patterns. Such templates serve not only basic sales tracking needs but can also be adapted for advanced data analysis techniques, including predictive modeling and forecasting.
Sales data analysis Excel template
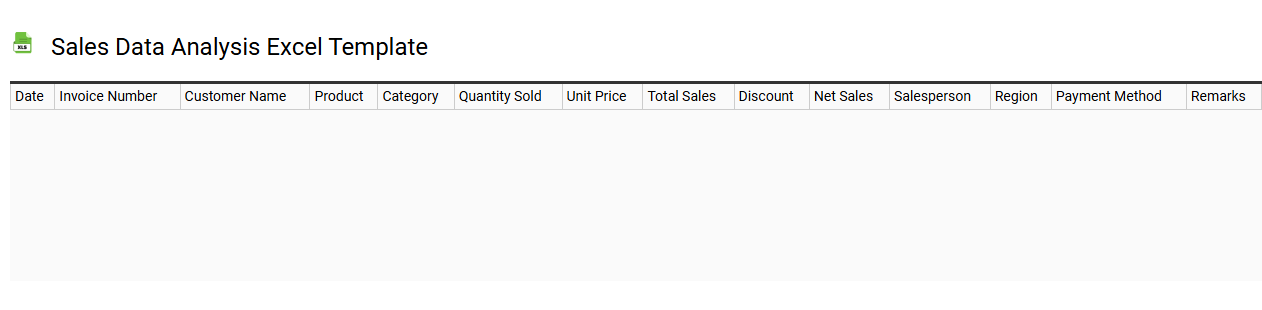
💾 Sales data analysis Excel template template .xls
Sales data analysis Excel templates offer a structured framework for organizing and examining sales data. These templates typically include pre-formatted tables, charts, and formulas that simplify the process of tracking sales performance over time. By utilizing features like pivot tables and conditional formatting, you can quickly identify trends, patterns, and outliers in your sales figures. Basic usage involves inputting your sales data, while further potential needs could encompass complex forecasting techniques or advanced analytics such as regression analysis and clustering algorithms.
Sales and revenue analysis Excel template
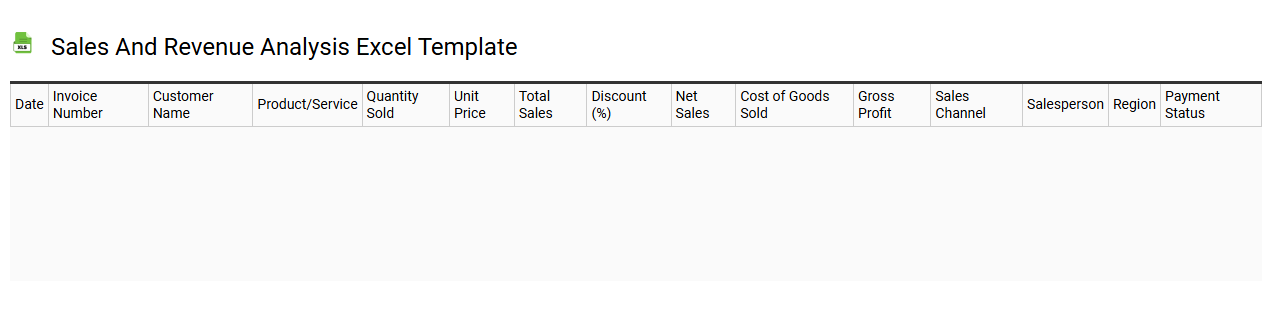
💾 Sales and revenue analysis Excel template template .xls
A Sales and Revenue Analysis Excel template is a pre-designed spreadsheet tool that helps you track, analyze, and visualize sales data over time. This template often includes features such as sales forecasts, revenue projections, and performance metrics to evaluate how well your business is doing financially. You can easily input data related to sales transactions, customer demographics, and product categories to gain insights that assist with strategic decision-making. Basic usage of this template can benefit your current sales strategy, while further potential needs may include advanced capabilities like predictive analytics or integration with business intelligence software.
Sales trend analysis Excel template
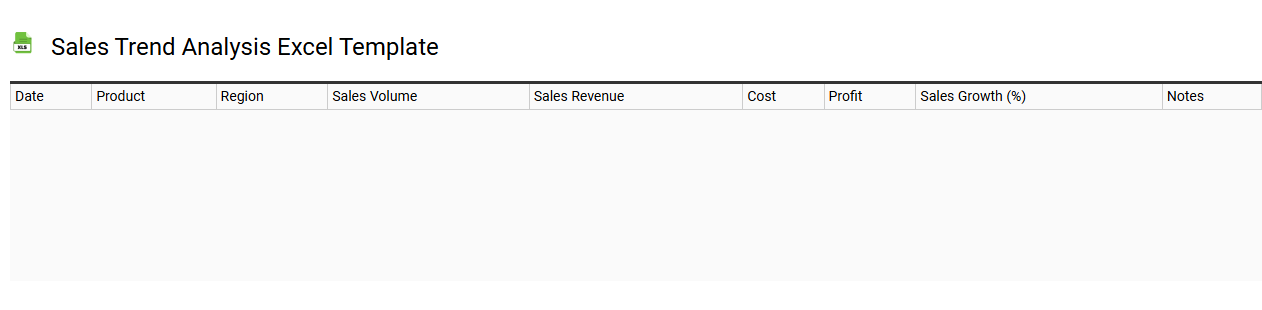
💾 Sales trend analysis Excel template template .xls
A Sales Trend Analysis Excel template serves as a structured tool for examining sales data over varying time periods. It typically includes visual elements like charts and graphs that help identify patterns, peaks, and troughs in sales performance. Users can input data related to sales volume, revenue, and customer purchases, allowing for easier interpretation of trends. Beyond basic usage, this template can be adapted for advanced analytics, incorporating forecasting models and predictive analytics to inform strategic sales decisions.