Explore a wide range of free XLS templates designed for sensitivity analysis in Excel. These templates offer structured frameworks for evaluating how varying inputs impact outcomes, facilitating informed decision-making. With user-friendly designs and clear data visualization, you can easily input your variables and gain insights into the potential risks and rewards of your financial models.
Sensitivity analysis Excel template for financial modeling
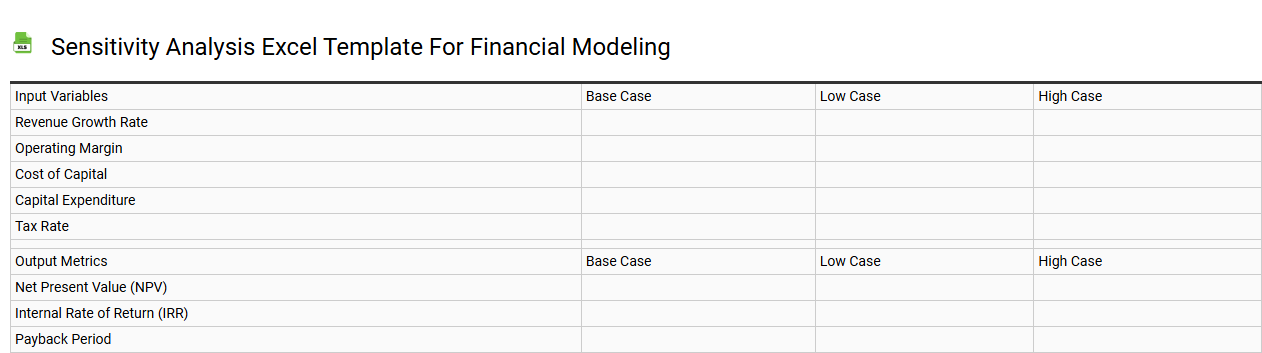
💾 Sensitivity analysis Excel template for financial modeling template .xls
A Sensitivity Analysis Excel template for financial modeling allows you to evaluate how different variables impact your financial outcomes. By changing input values, you can visualize the effects on key metrics such as net present value (NPV), internal rate of return (IRR), or cash flow projections. This tool provides a clear comparison of best, worst, and most likely scenarios, enhancing your decision-making process. You can utilize basic models to explore various factors, and as your analysis needs grow, you may want to incorporate advanced simulations like Monte Carlo analysis or scenario planning.
Scenario sensitivity analysis Excel template
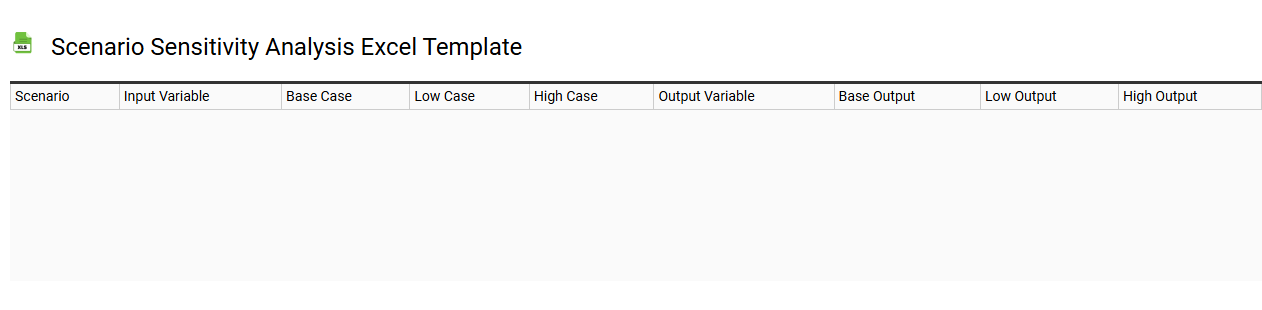
💾 Scenario sensitivity analysis Excel template template .xls
Scenario sensitivity analysis in an Excel template allows you to evaluate how different variables impact outcomes. Users can create various scenarios by adjusting inputs such as sales volume, costs, and growth rates to see how these changes influence key performance indicators. This process visualizes the potential effects on metrics like revenue or profit margins, aiding in informed decision-making. For basic usage, you can start by modifying simple variables, while more advanced needs could involve integrating Monte Carlo simulations or regression modeling.
Investment sensitivity analysis Excel template
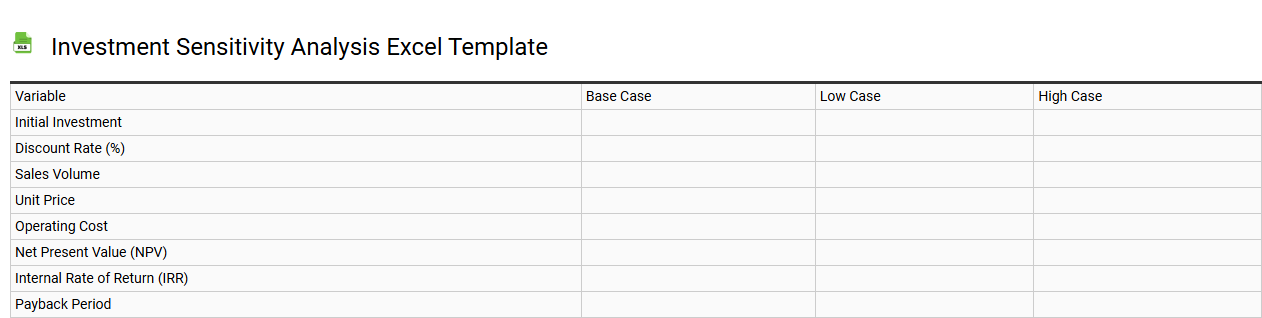
💾 Investment sensitivity analysis Excel template template .xls
The Investment Sensitivity Analysis Excel template is a powerful tool designed to evaluate how changes in key assumptions impact the overall performance of an investment. It allows you to input various parameters, such as anticipated returns, market conditions, and risk factors, making it easier to visualize potential outcomes. You can adjust these variables to see their effect on cash flows and net present value, providing insights into which factors are most critical to your investment's success. Such templates can also be expanded to include more advanced techniques like Monte Carlo simulations or scenario analysis for in-depth risk assessment.
Sensitivity analysis Excel template for project management
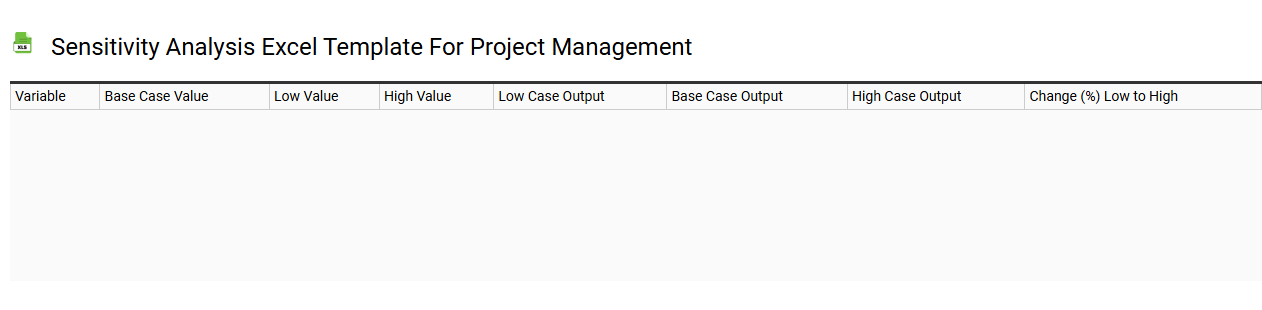
💾 Sensitivity analysis Excel template for project management template .xls
A Sensitivity Analysis Excel template for project management allows you to assess how changes in key variables impact project outcomes. This template features input sections for variable parameters, such as costs, timeframes, and resource allocations, allowing you to easily modify these figures. Graphs and charts visualize the influence of different scenarios, making it easier to identify critical factors and potential risks. Using this tool helps in making informed decisions, while you can further explore advanced techniques like Monte Carlo simulations or decision tree analyses for deeper insights.
Sensitivity analysis Excel template with data table
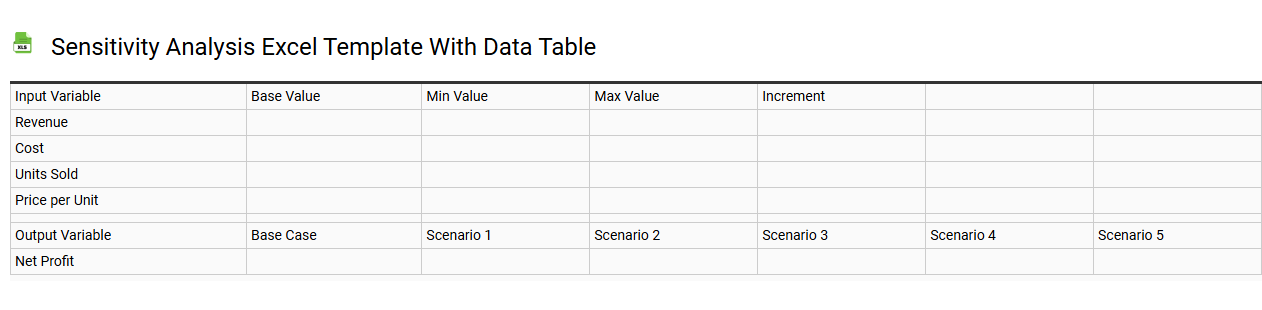
💾 Sensitivity analysis Excel template with data table template .xls
A sensitivity analysis Excel template using a data table helps assess how variations in key input variables impact a specific output or result. This interactive tool allows you to organize data efficiently, enabling you to identify which factors exert the most influence on your outcomes. By setting up a data table, you can quickly visualize the relationship between inputs and outputs, enhancing your decision-making process. Your analysis may begin with basic scenarios but can evolve into complex models, integrating advanced concepts such as Monte Carlo simulations or scenario planning for more nuanced insights.
Discount rate sensitivity analysis Excel template
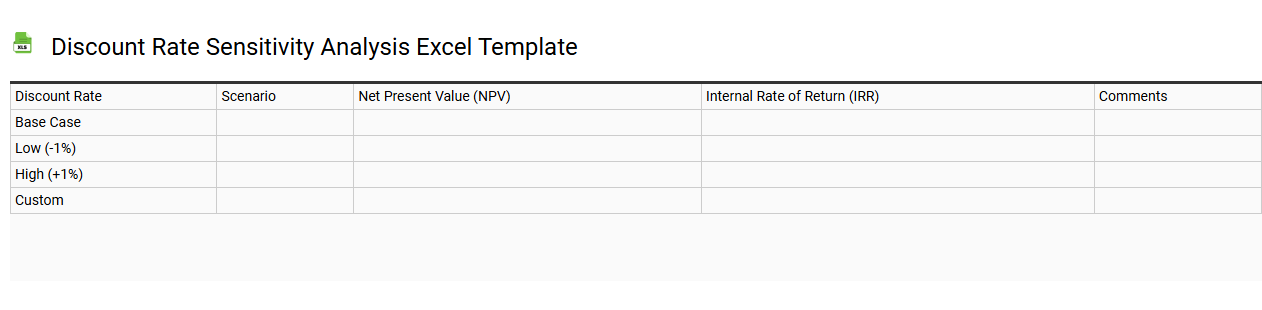
💾 Discount rate sensitivity analysis Excel template template .xls
A Discount Rate Sensitivity Analysis Excel template allows you to evaluate how varying discount rates impact the net present value (NPV) of cash flows. It typically features a grid or table format, enabling you to adjust discount rates and immediately see the effects on NPV calculations. This tool is essential in financial modeling, particularly for investment decisions, as it helps identify the range of potential outcomes based on different economic scenarios. You can use it for basic NPV calculations or delve into more advanced topics like internal rate of return (IRR) and financial projections for long-term projects.
Real estate sensitivity analysis Excel template
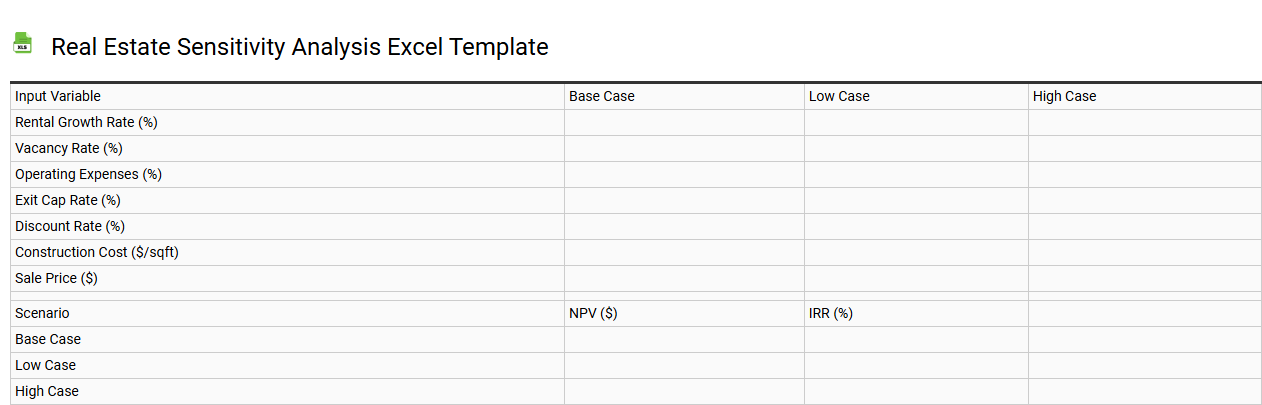
💾 Real estate sensitivity analysis Excel template template .xls
A Real Estate Sensitivity Analysis Excel template is a structured tool designed to evaluate how various factors impact the financial performance of real estate investments. This template allows you to input variables such as interest rates, vacancy rates, and rental income, helping to assess potential risks and returns. By changing these inputs, you can visualize potential outcomes in a clear, organized format, making it easier to identify which factors have the greatest influence on your investment. Such templates can be tailored for detailed cash flow projections, financing scenarios, and scenario analyses, ensuring that you are well-prepared for both basic usage and advanced applications like Monte Carlo simulations or sensitivity modeling.
Sensitivity analysis Excel template for cost estimating
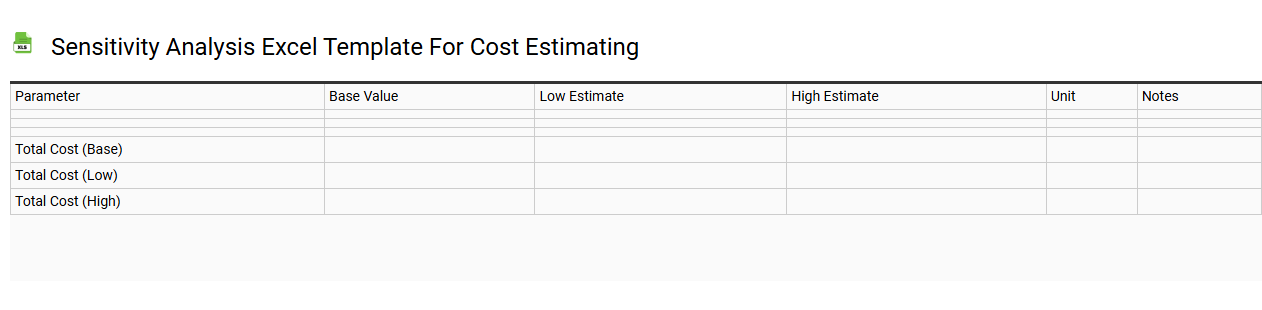
💾 Sensitivity analysis Excel template for cost estimating template .xls
A Sensitivity Analysis Excel template for cost estimating visually represents how various independent variables impact a dependent cost variable. This tool allows you to input different assumptions around cost drivers, such as labor rates, material costs, and overheads, creating dynamic outcomes. Clear charts and tables portray relationships between changing inputs and resulting costs, making it easier for you to identify which factors significantly influence project budgets. This basic usage of the template can expand into more advanced scenarios, including risk assessment and decision trees, enabling comprehensive financial modeling.
Profit and loss sensitivity analysis Excel template
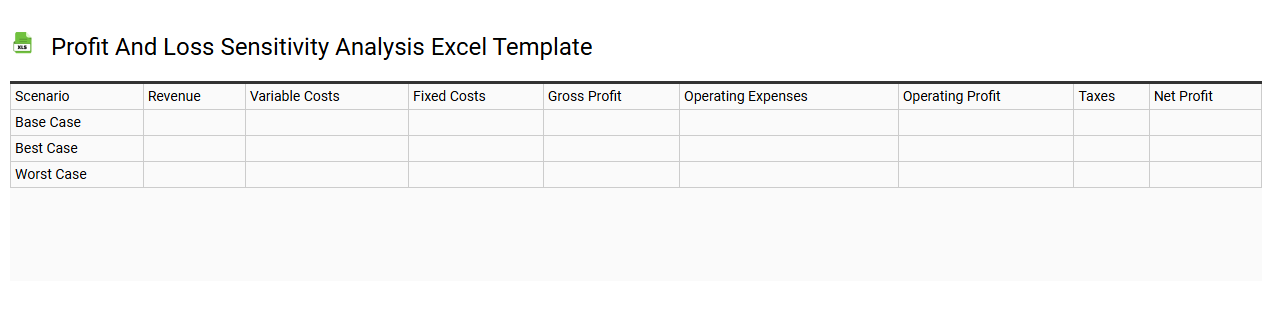
💾 Profit and loss sensitivity analysis Excel template template .xls
A Profit and Loss Sensitivity Analysis Excel template helps you evaluate how changes in key variables affect your business's profitability. This template typically includes rows for revenue, costs, and profit margins, allowing you to input different scenarios such as varying sales volumes or cost fluctuations. You can visualize potential outcomes through charts that represent calculated profit or loss under various conditions. By using this template, you can better anticipate financial impacts and make informed strategic decisions regarding pricing, budgeting, and risk management. Exploring further, you might consider incorporating advanced elements like scenario modeling or Monte Carlo simulations to enhance predictive accuracy.
Sensitivity analysis Excel template for risk assessment
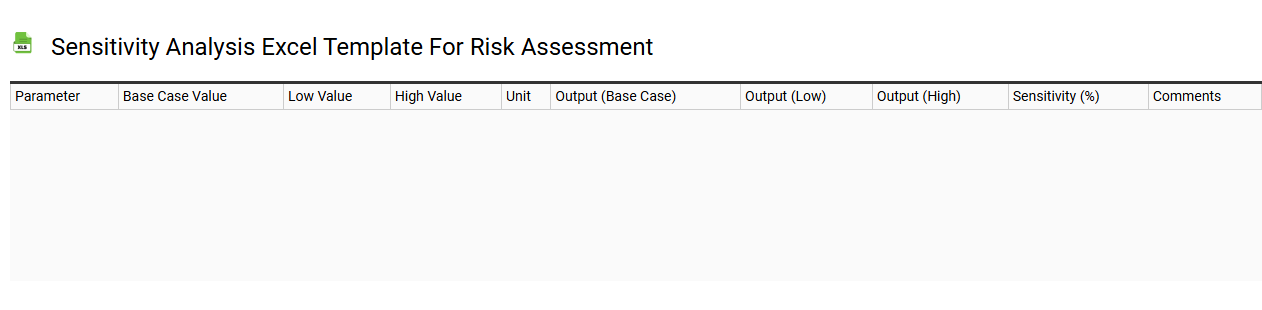
💾 Sensitivity analysis Excel template for risk assessment template .xls
A Sensitivity Analysis Excel template is designed to help you evaluate how changes in input variables impact outcomes in a financial model or project. It enables you to manipulate key assumptions, such as costs or sales, and observe how these variations affect overall results, providing crucial insights for risk assessment. This template typically includes user-friendly data tables or charts for easy visualization of the relationships between parameters and their respective impacts. By utilizing this tool effectively, you can identify potential risks and make informed decisions, guiding you towards basic analysis or more advanced financial modeling techniques like Monte Carlo simulations or scenario planning.