Explore a range of free XLS templates designed specifically for sales reporting in Excel. Each template features organized sections for tracking sales data, including metrics like total sales, growth rates, and customer insights. Customizable fields allow you to adapt the templates to fit your unique business needs, ensuring clear visualization of performance trends and actionable insights.
Yearly sales report Excel template
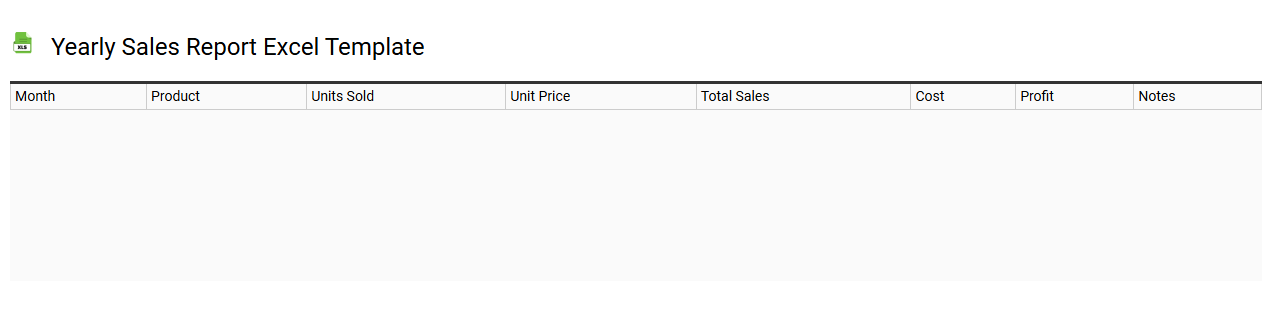
💾 Yearly sales report Excel template template .xls
A yearly sales report Excel template is a pre-designed spreadsheet that enables businesses to track and analyze their sales performance over a 12-month period. This template typically includes various sections for key metrics such as total sales, sales by product category, and comparisons to previous years. Customizable charts and graphs help visualize trends, making data interpretation straightforward. For your business needs, this template can serve as a foundation for deeper analyses, incorporating advanced functions like pivot tables and forecasting models.
Sales pipeline Excel template
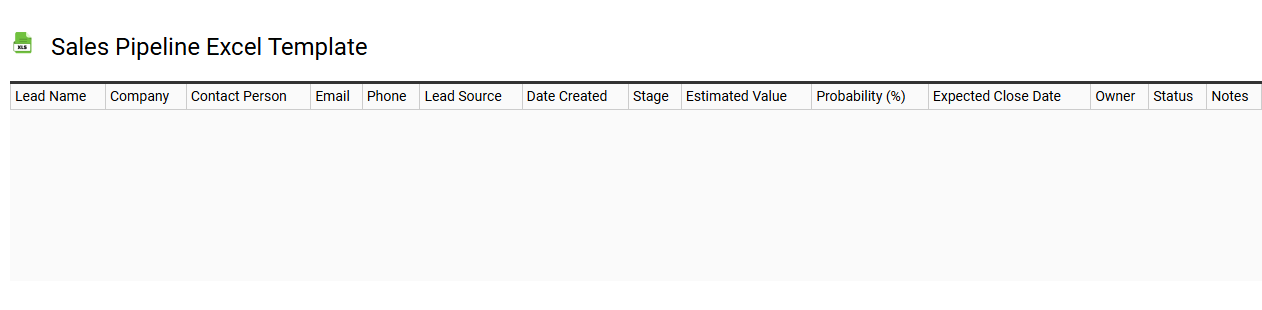
💾 Sales pipeline Excel template template .xls
A Sales pipeline Excel template is a structured tool designed to help businesses track and manage their sales processes efficiently. It typically includes various sections for capturing lead information, sales stages, potential revenue, and expected closing dates. This organized framework allows you to visualize your sales journey, identify opportunities, and monitor progress through different stages, from initial contact to final sale. With basic usage focused on managing leads and sales forecasts, further potential needs may involve integration with advanced CRM systems and data analytics for deeper insights into sales performance.
Regional sales report Excel template
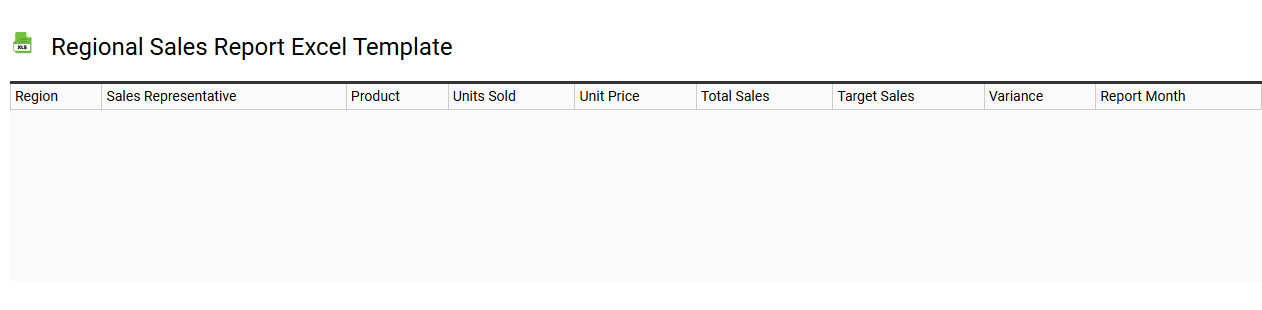
💾 Regional sales report Excel template template .xls
A Regional Sales Report Excel template is a structured spreadsheet designed to track sales performance across different geographic areas. It typically includes sections for sales figures, product categories, and comparisons to previous periods, enabling clear visual representation through charts and graphs. You can easily customize the template to align with specific business metrics, facilitating deeper insights into market trends and customer preferences. Suitable for basic sales tracking, it can also be enhanced for advanced data analysis, forecasting, and business intelligence needs.
Product-wise sales report Excel template
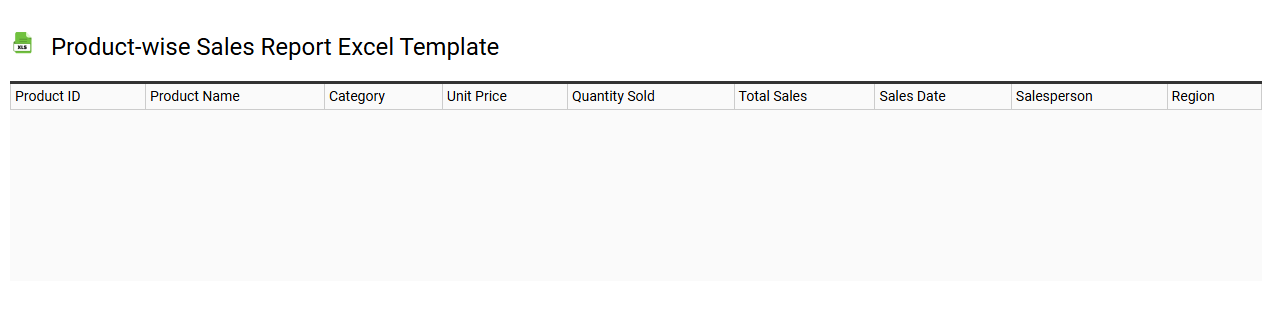
💾 Product-wise sales report Excel template template .xls
A Product-wise sales report Excel template is a pre-designed spreadsheet tool that allows businesses to track and analyze sales performance for individual products. This template typically includes columns for product names, sales quantities, revenue figures, and time periods, providing a clear overview of how each product is performing. Through visual aids like charts and graphs, the template simplifies the identification of trends and patterns in sales data. You can adapt this template for more advanced analysis, such as forecasting demand or conducting market segmentation studies.
Sales dashboard Excel template
💾 Sales dashboard Excel template template .xls
A Sales dashboard Excel template serves as a powerful tool for visualizing and analyzing sales data effectively. It typically includes key performance indicators (KPIs) such as total sales, sales growth, and customer acquisition rates presented through various charts and graphs. Users can input their data to get real-time insights on performance trends, sales representatives' achievements, and product performance. This user-friendly interface allows for easy tracking of sales goals and comprehensive reporting, paving the way for sophisticated analytics and actionable strategies in dynamic business environments.
Weekly sales summary Excel template
💾 Weekly sales summary Excel template template .xls
A Weekly Sales Summary Excel template is a structured tool designed to help businesses efficiently track and analyze sales performance over a week. It typically includes key data points such as total sales revenue, the number of transactions, and sales by product category or region. This template allows for easy visualization through charts and graphs, enabling you to spot trends and make informed decisions quickly. For users looking to expand their capabilities, incorporating advanced functionalities like pivot tables and dynamic dashboards can further enhance data analysis and reporting potential.